URIP Page-by-Page Walk-through
Last updated: 2026-04-30 Audience: Buyers evaluating URIP, security analysts onboarding, compliance officers preparing for audit. Read this end-to-end and you'll have seen every URIP screen that matters — no demo call needed.
This is the customer's walk-through. Operational screens (notifications, search, settings, password resets) are described in one paragraph each because every SaaS has them. We focus on the 30 screens that actually decide whether URIP solves your problem.
For each page you'll see:
- What it shows — the live screenshot at
https://urip.adaptive-mind.com - What you do here — the primary actions
- Where the data comes from — which connector / module feeds the page (where relevant)
Table of Contents
- 1. Sign in
- 2. Daily cockpit
- Risk Intelligence dashboard
- Audit log
- 3. Risk Center
- Risk overview
- Risk register
- Risk quantification (FAIR)
- Attack path
- Remediation tracker
- Risk acceptance workflow
- Reports
- Threat map
- 4. Strategic modules
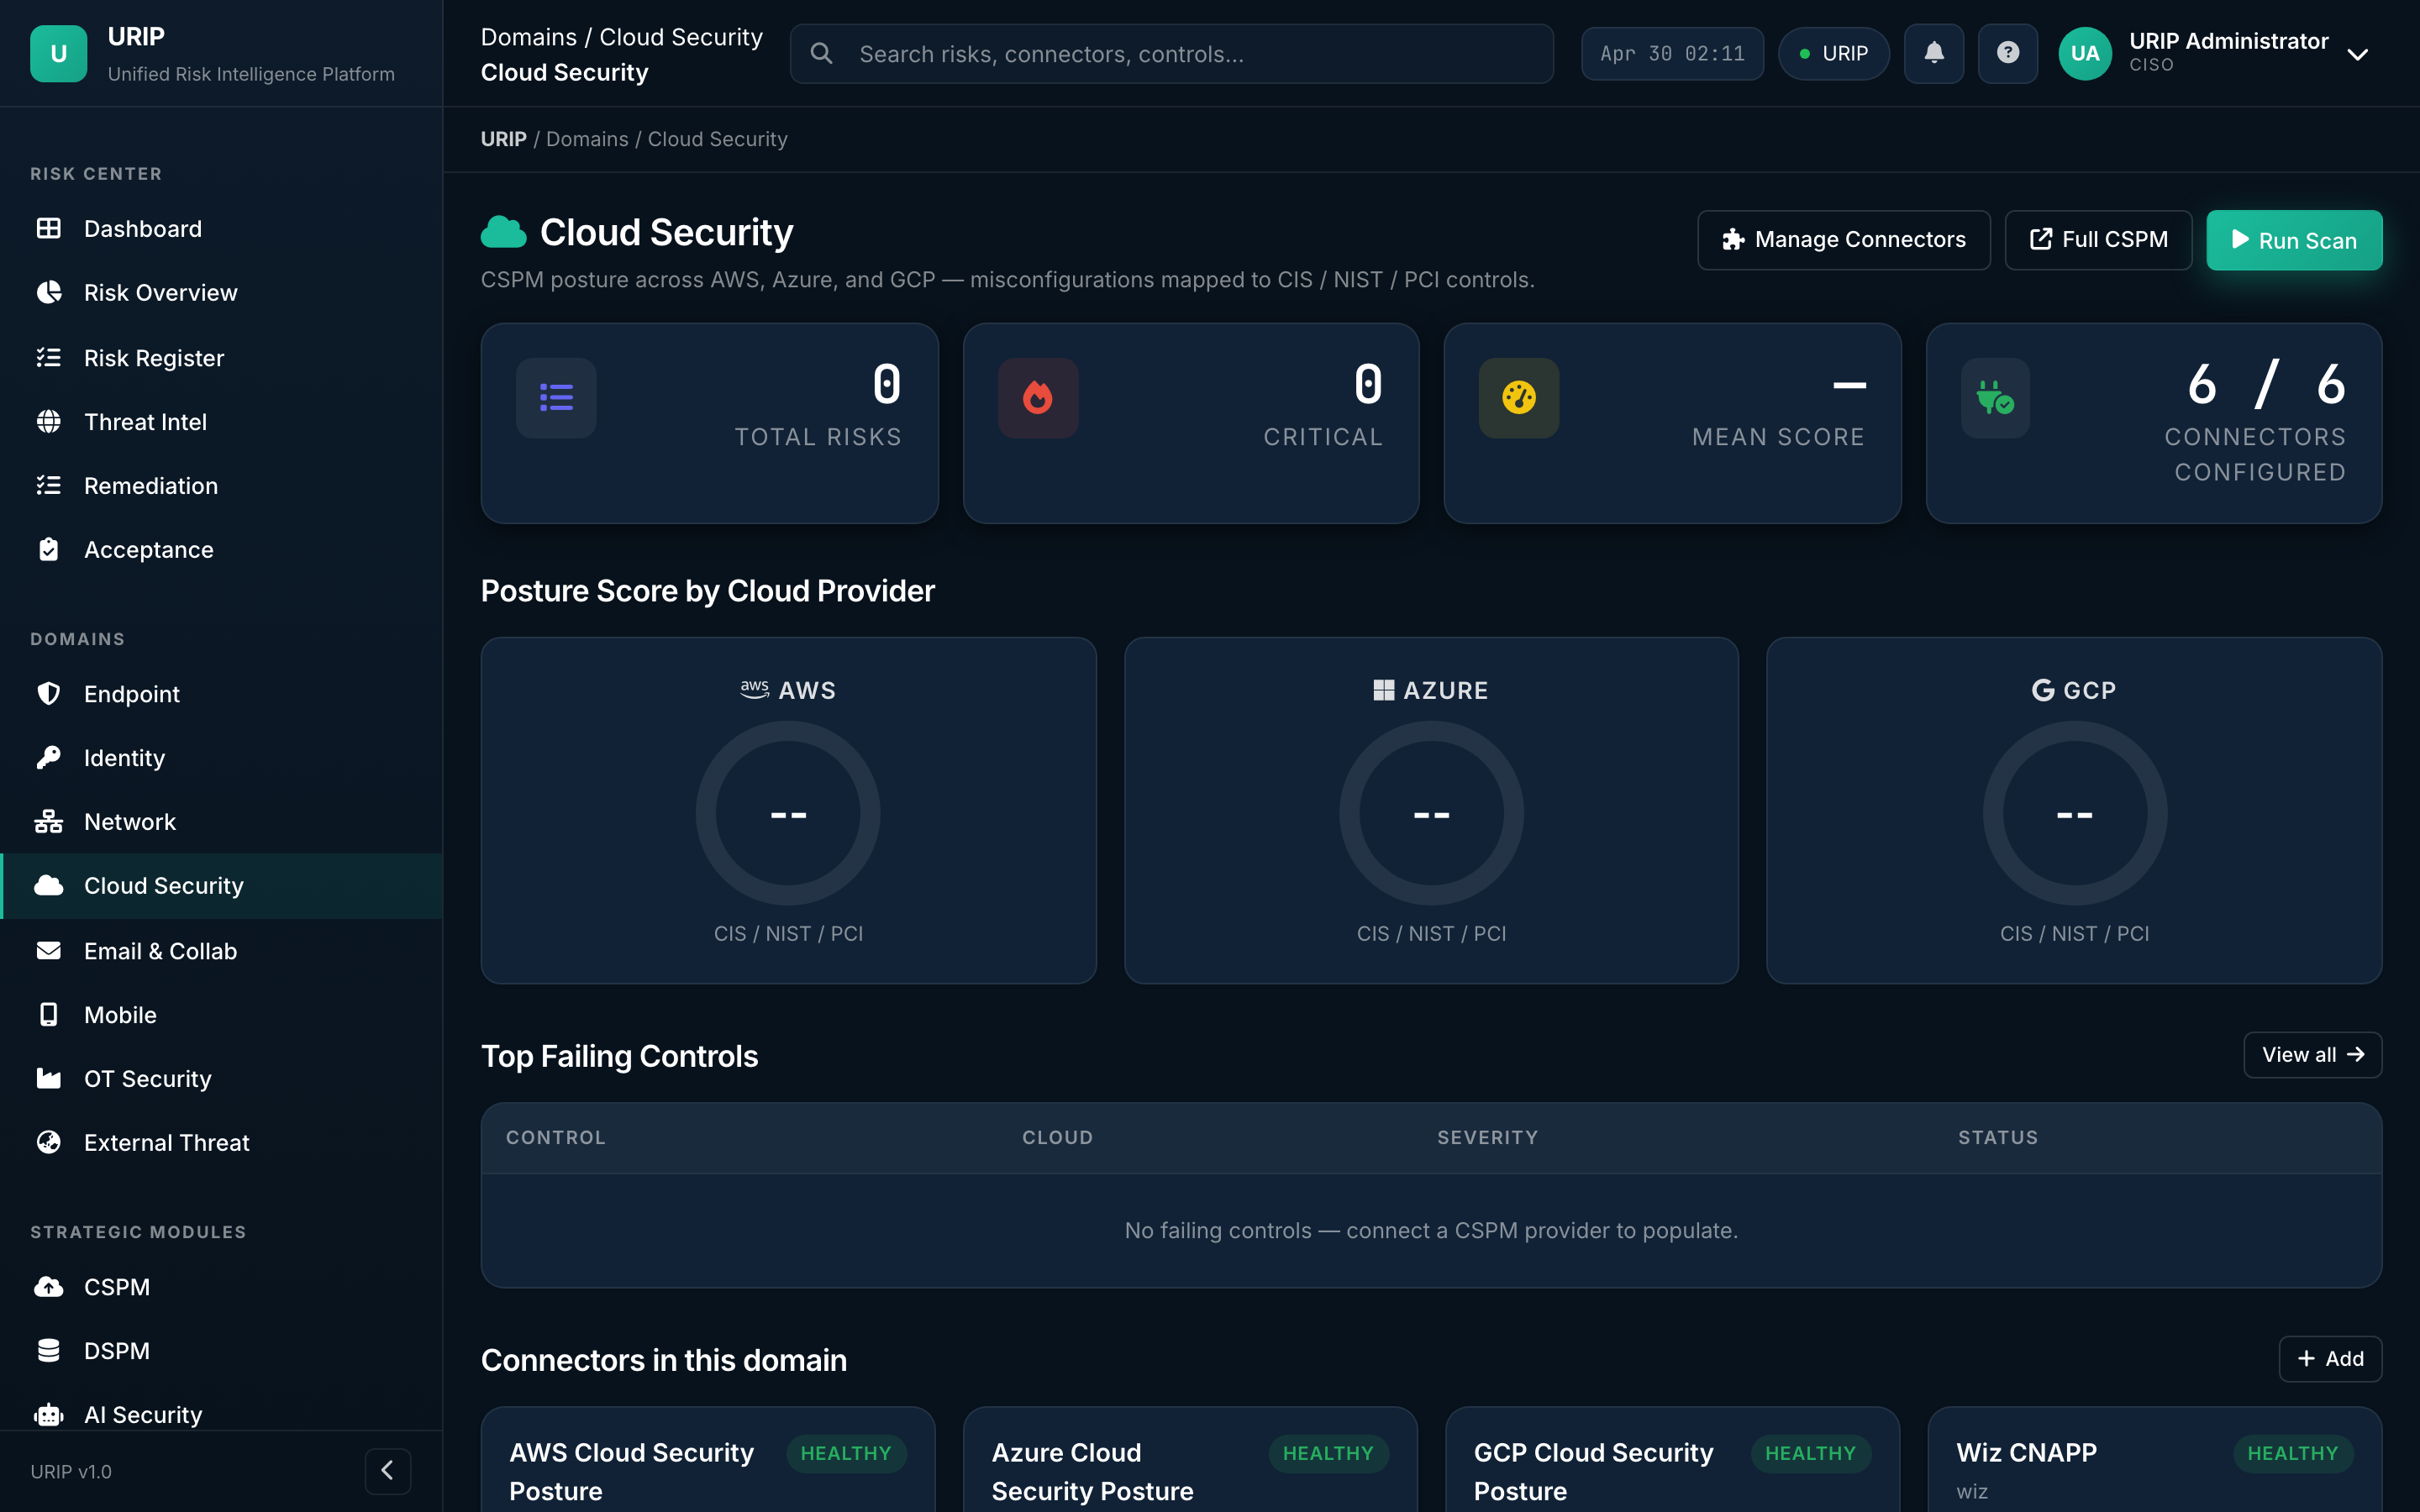
- CSPM dashboard
- CSPM findings
- DSPM dashboard
- AI Security dashboard
- ZTNA dashboard
- 5. Domain rollups
- Endpoint (representative)
- Cloud (representative)
- 6. Assets, connectors, admin
- Asset inventory
- Tool catalog
- Connector wizard
- Connector status
- Admin overview
- VAPT submissions inbox
- 7. Compliance suite
- Frameworks
- Controls
- Policies
- Evidence library
- Evidence requests (auditor inbox)
- Vendor risk
- Compliance reports
- End-to-end demo path
1. Sign in
URL: /login.html
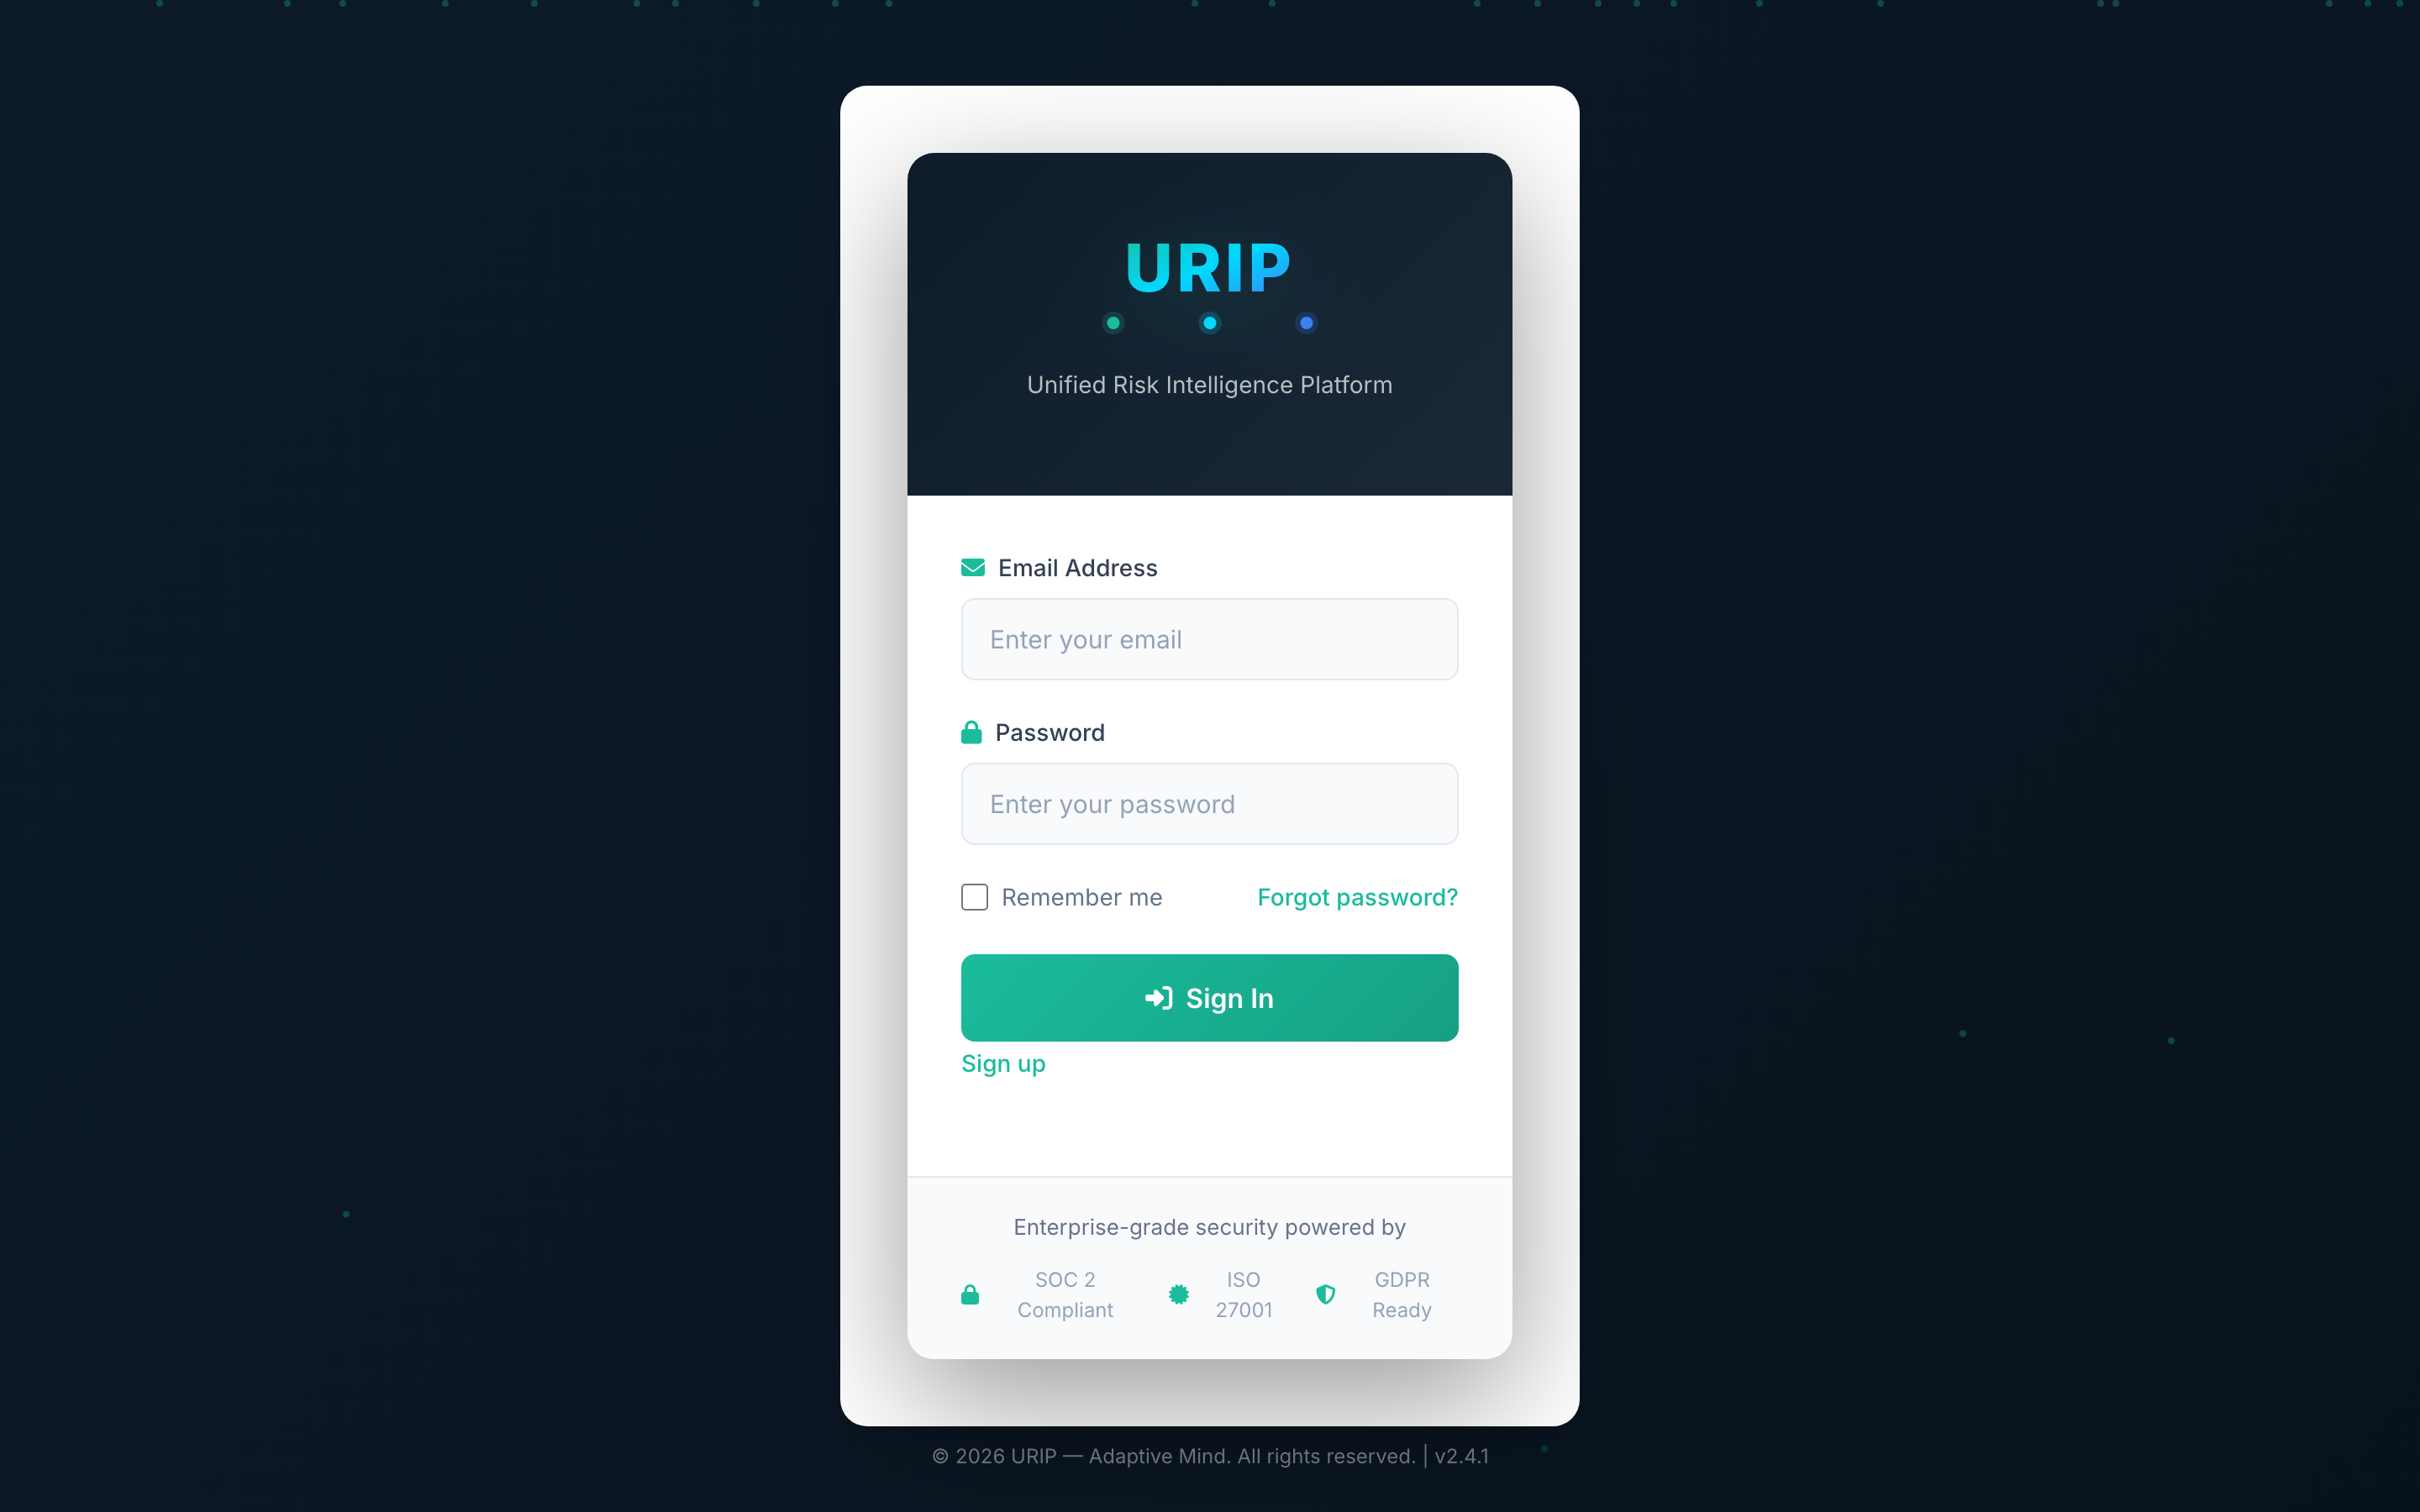
What it shows. Email + password form. If your tenant has SSO enabled, an SSO button appears here. After successful credential check the form prompts for an MFA code (TOTP).
What you do here. Enter your email + password → click Sign in → enter your authenticator code → land on the dashboard.
Aux entry points (no separate screenshots — they are minor):
- /register.html — first user of a new tenant uses this with the Tenant ID their admin emailed them.
- /forgot-password.html & /reset-password.html — standard self-service reset flow.
- /vendor-login.html — external auditors / vendors with a time-bound invitation link.
- /vapt-portal-login.html — separate sign-in for pen-test vendors who submit findings into your URIP.
- /mfa-enroll.html — first-time TOTP setup; URIP enforces MFA on every login.
2. Daily cockpit
After sign-in every page shares the same left sidebar (modules, your tenant) and topbar (search, notifications, user menu). Operational widgets like the global search box, the notifications drawer, and the per-user settings page are standard SaaS — they exist, they work, you'll find them in the topbar. Sign-in lands you straight on the dashboard.
Risk Intelligence dashboard
URL: /dashboard.html
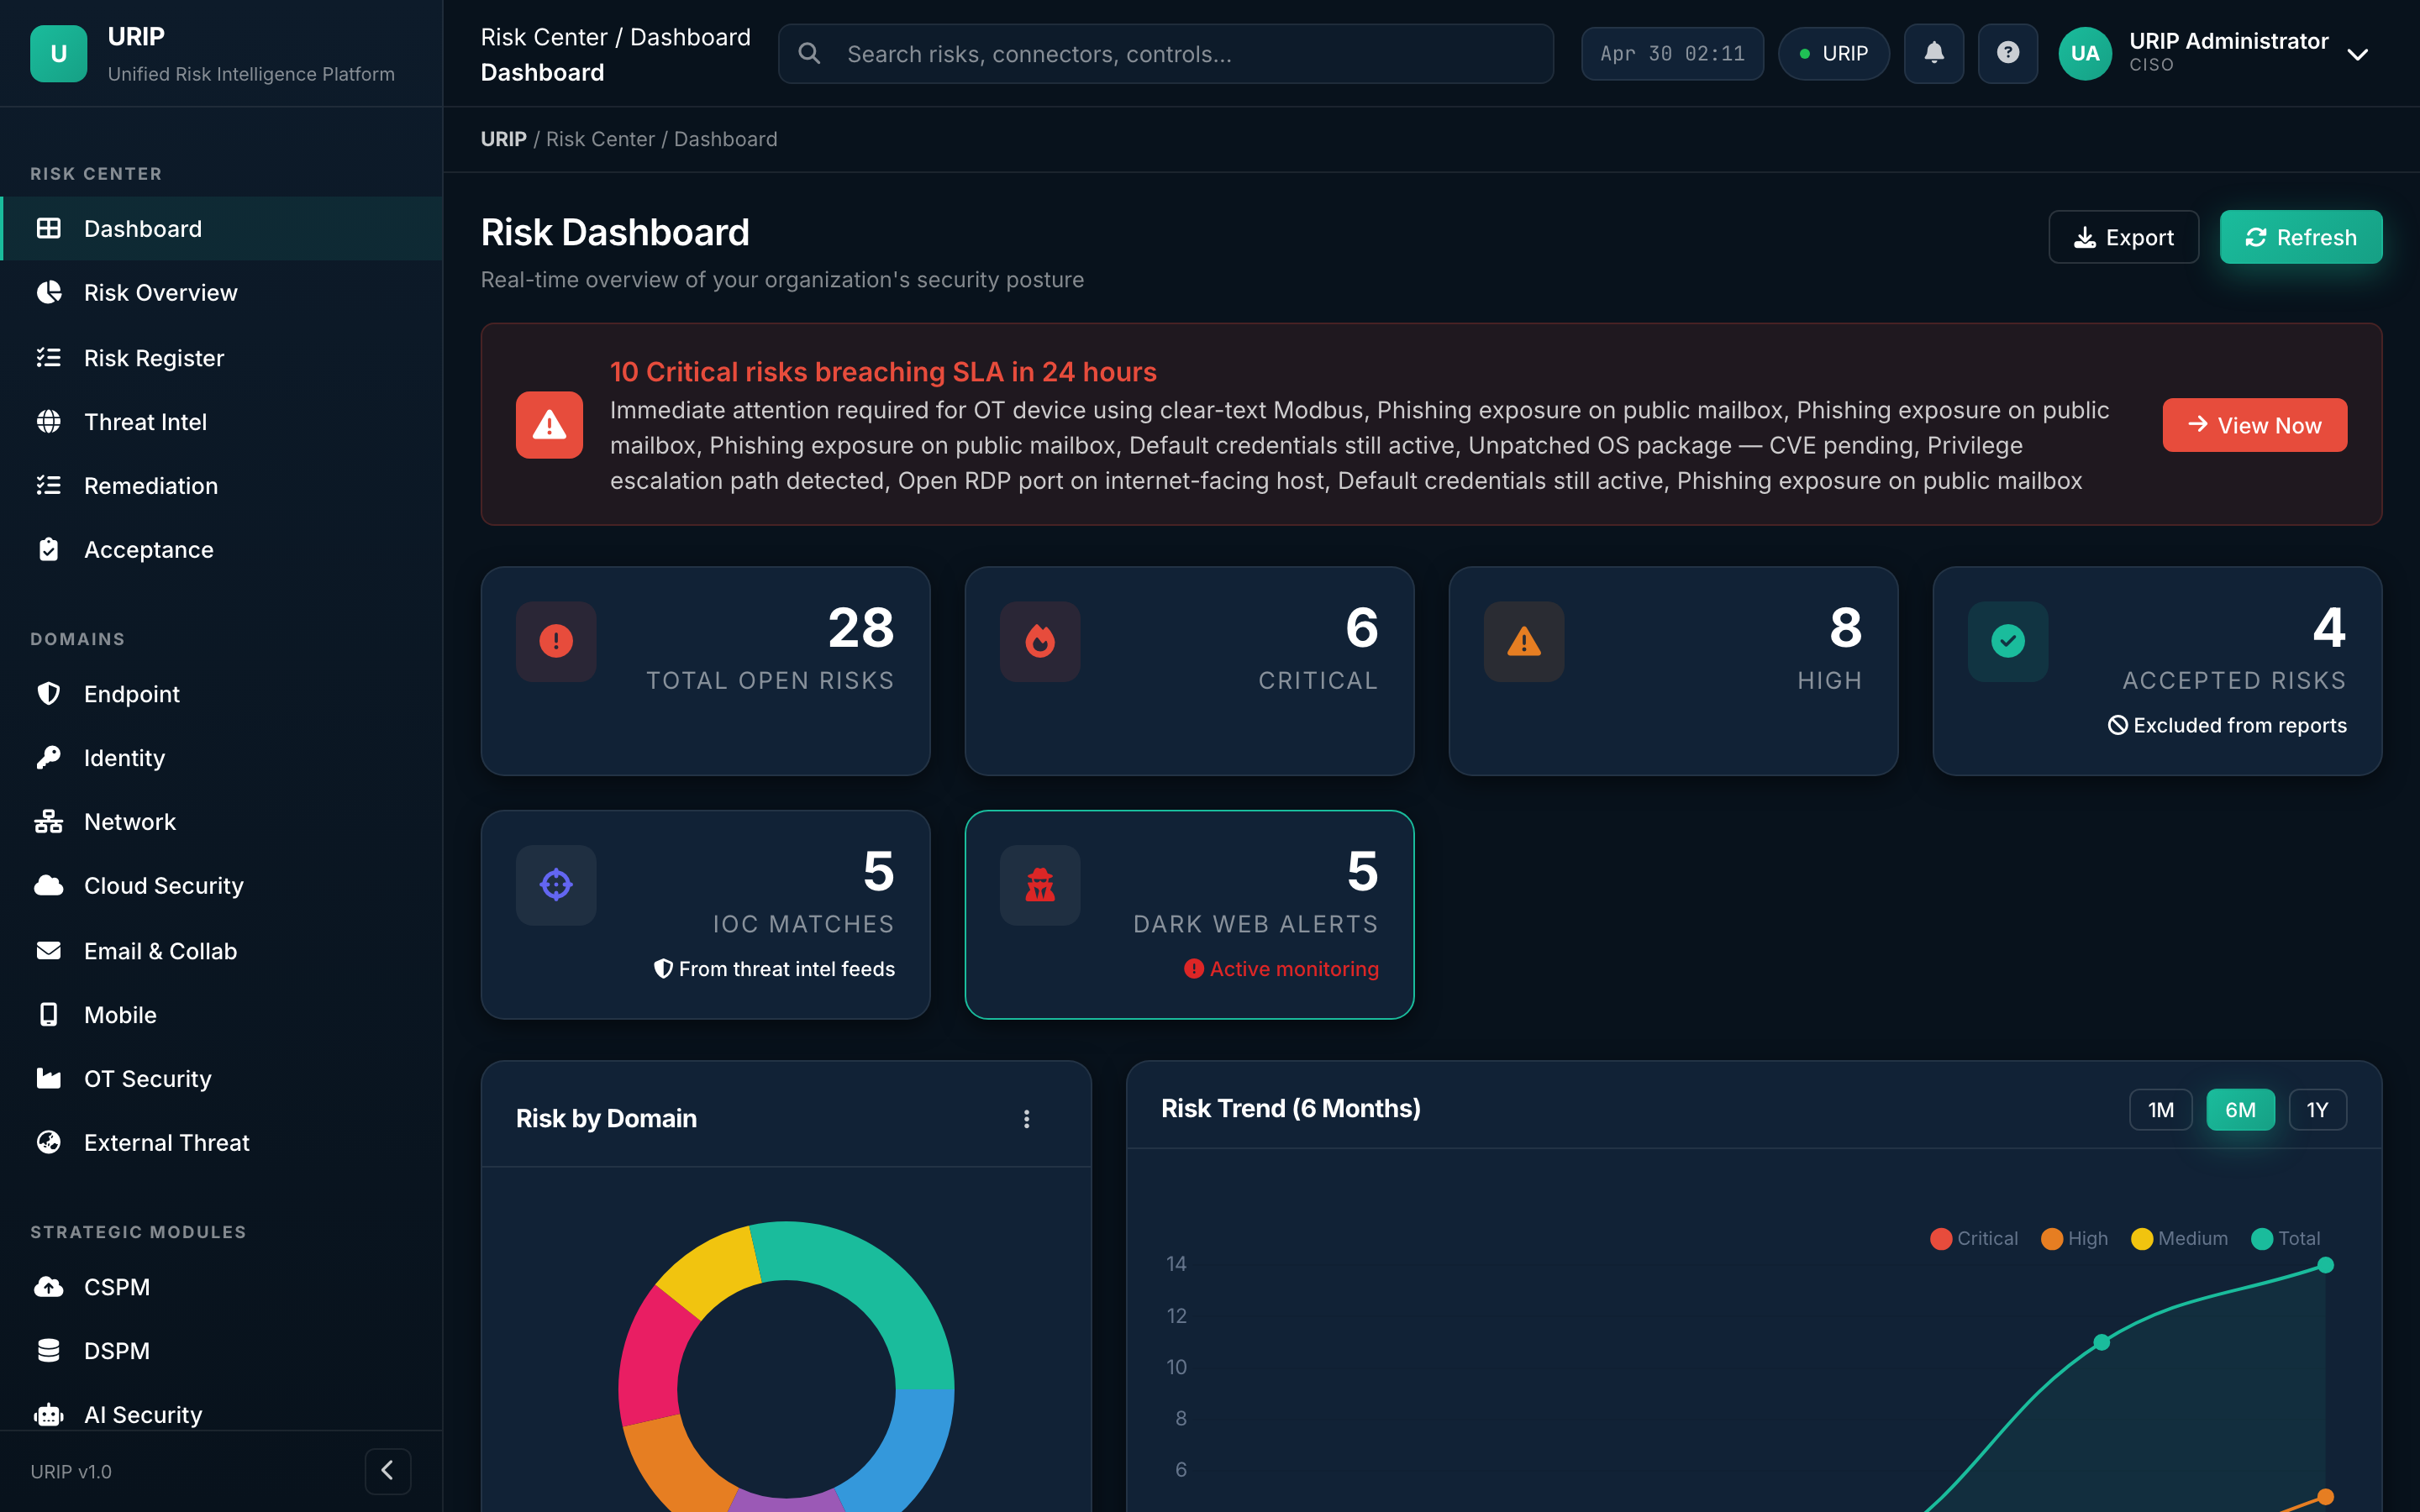
What it shows. The CISO's daily cockpit. Open risk count, critical / high / medium / low split, IOC matches, KEV-tagged risks, top 5 affected assets, 30-day trend lines, and a heat map across the eight domains (Endpoint, Identity, Network, Cloud, Email, Mobile, OT, External Threat).
What you do here. Watch the KPIs at the top of the day, drill into anything red, click any tile to land on the underlying register.
Audit log
URL: /audit-log.html
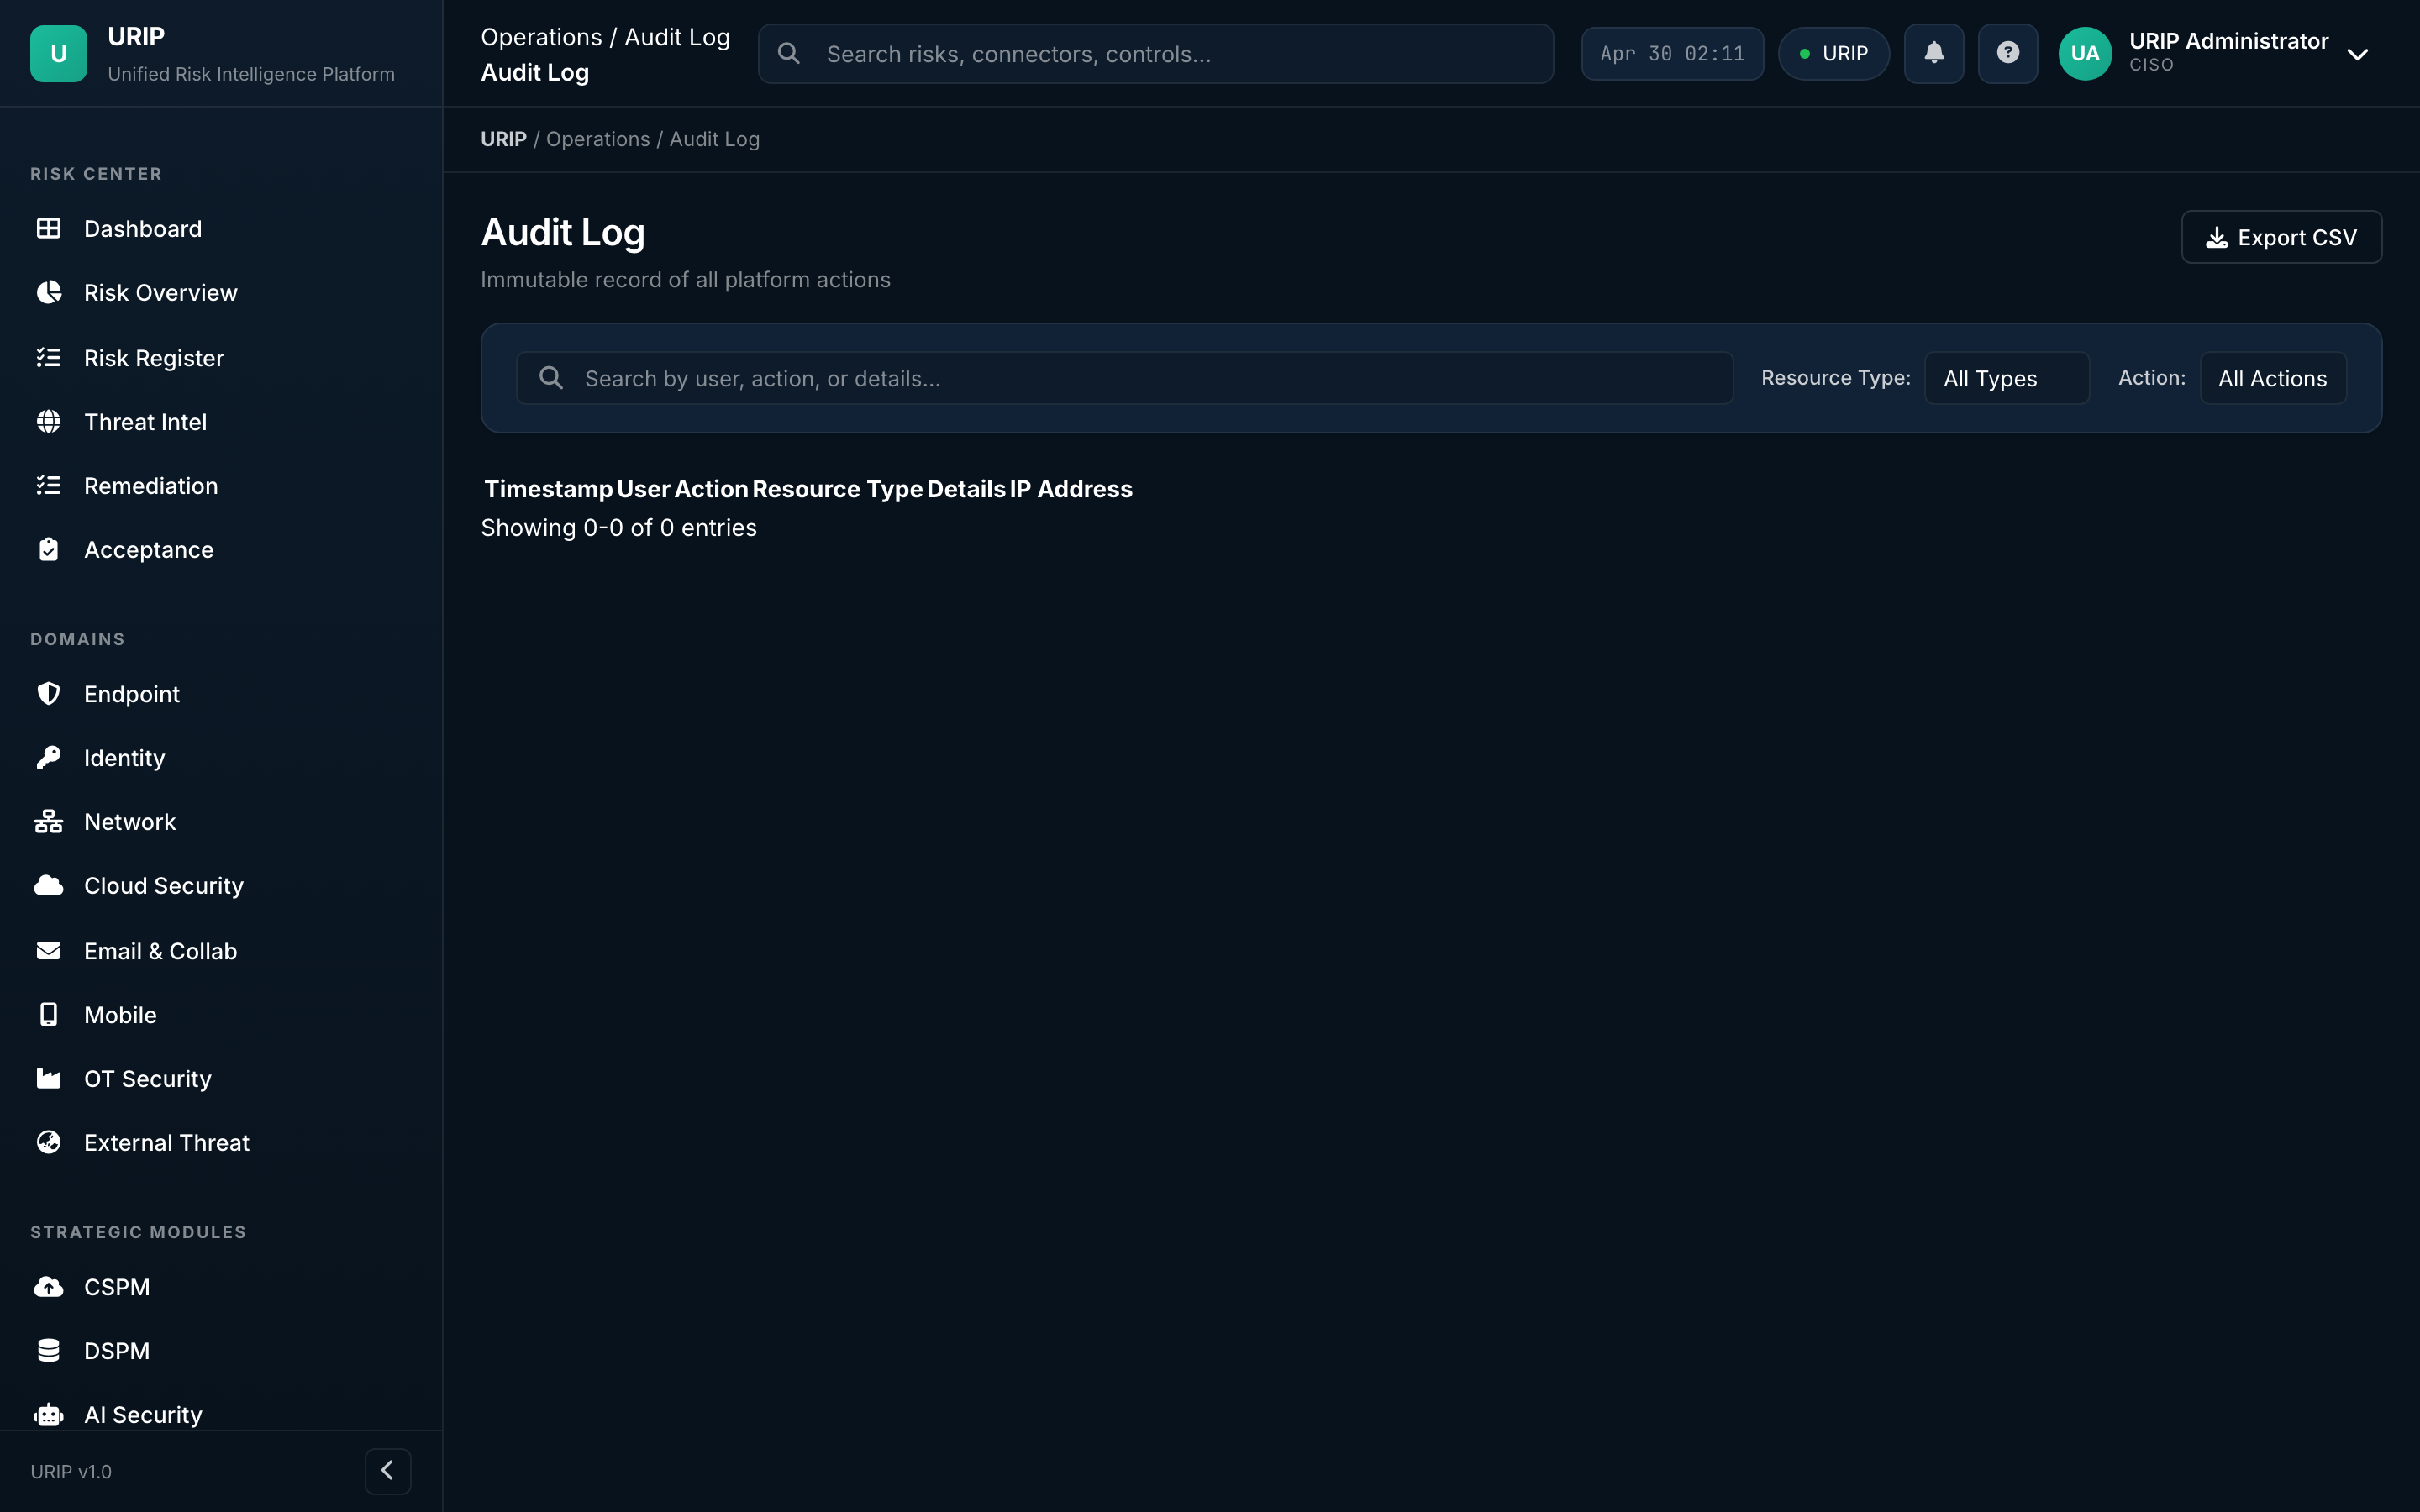
What it shows. Immutable, hash-chained log of every state change — who did what, when, on which entity. Used during SOC 2 / ISO 27001 audits to prove integrity. Each row is signed and linked to the previous row's hash, so any tamper is detectable.
What you do here. Filter by user, action, entity, or time window. Export a CSV for your auditor.
3. Risk Center
The Risk Center is the home of every analyst. Open it from the sidebar.
Risk overview
URL: /risk-overview.html
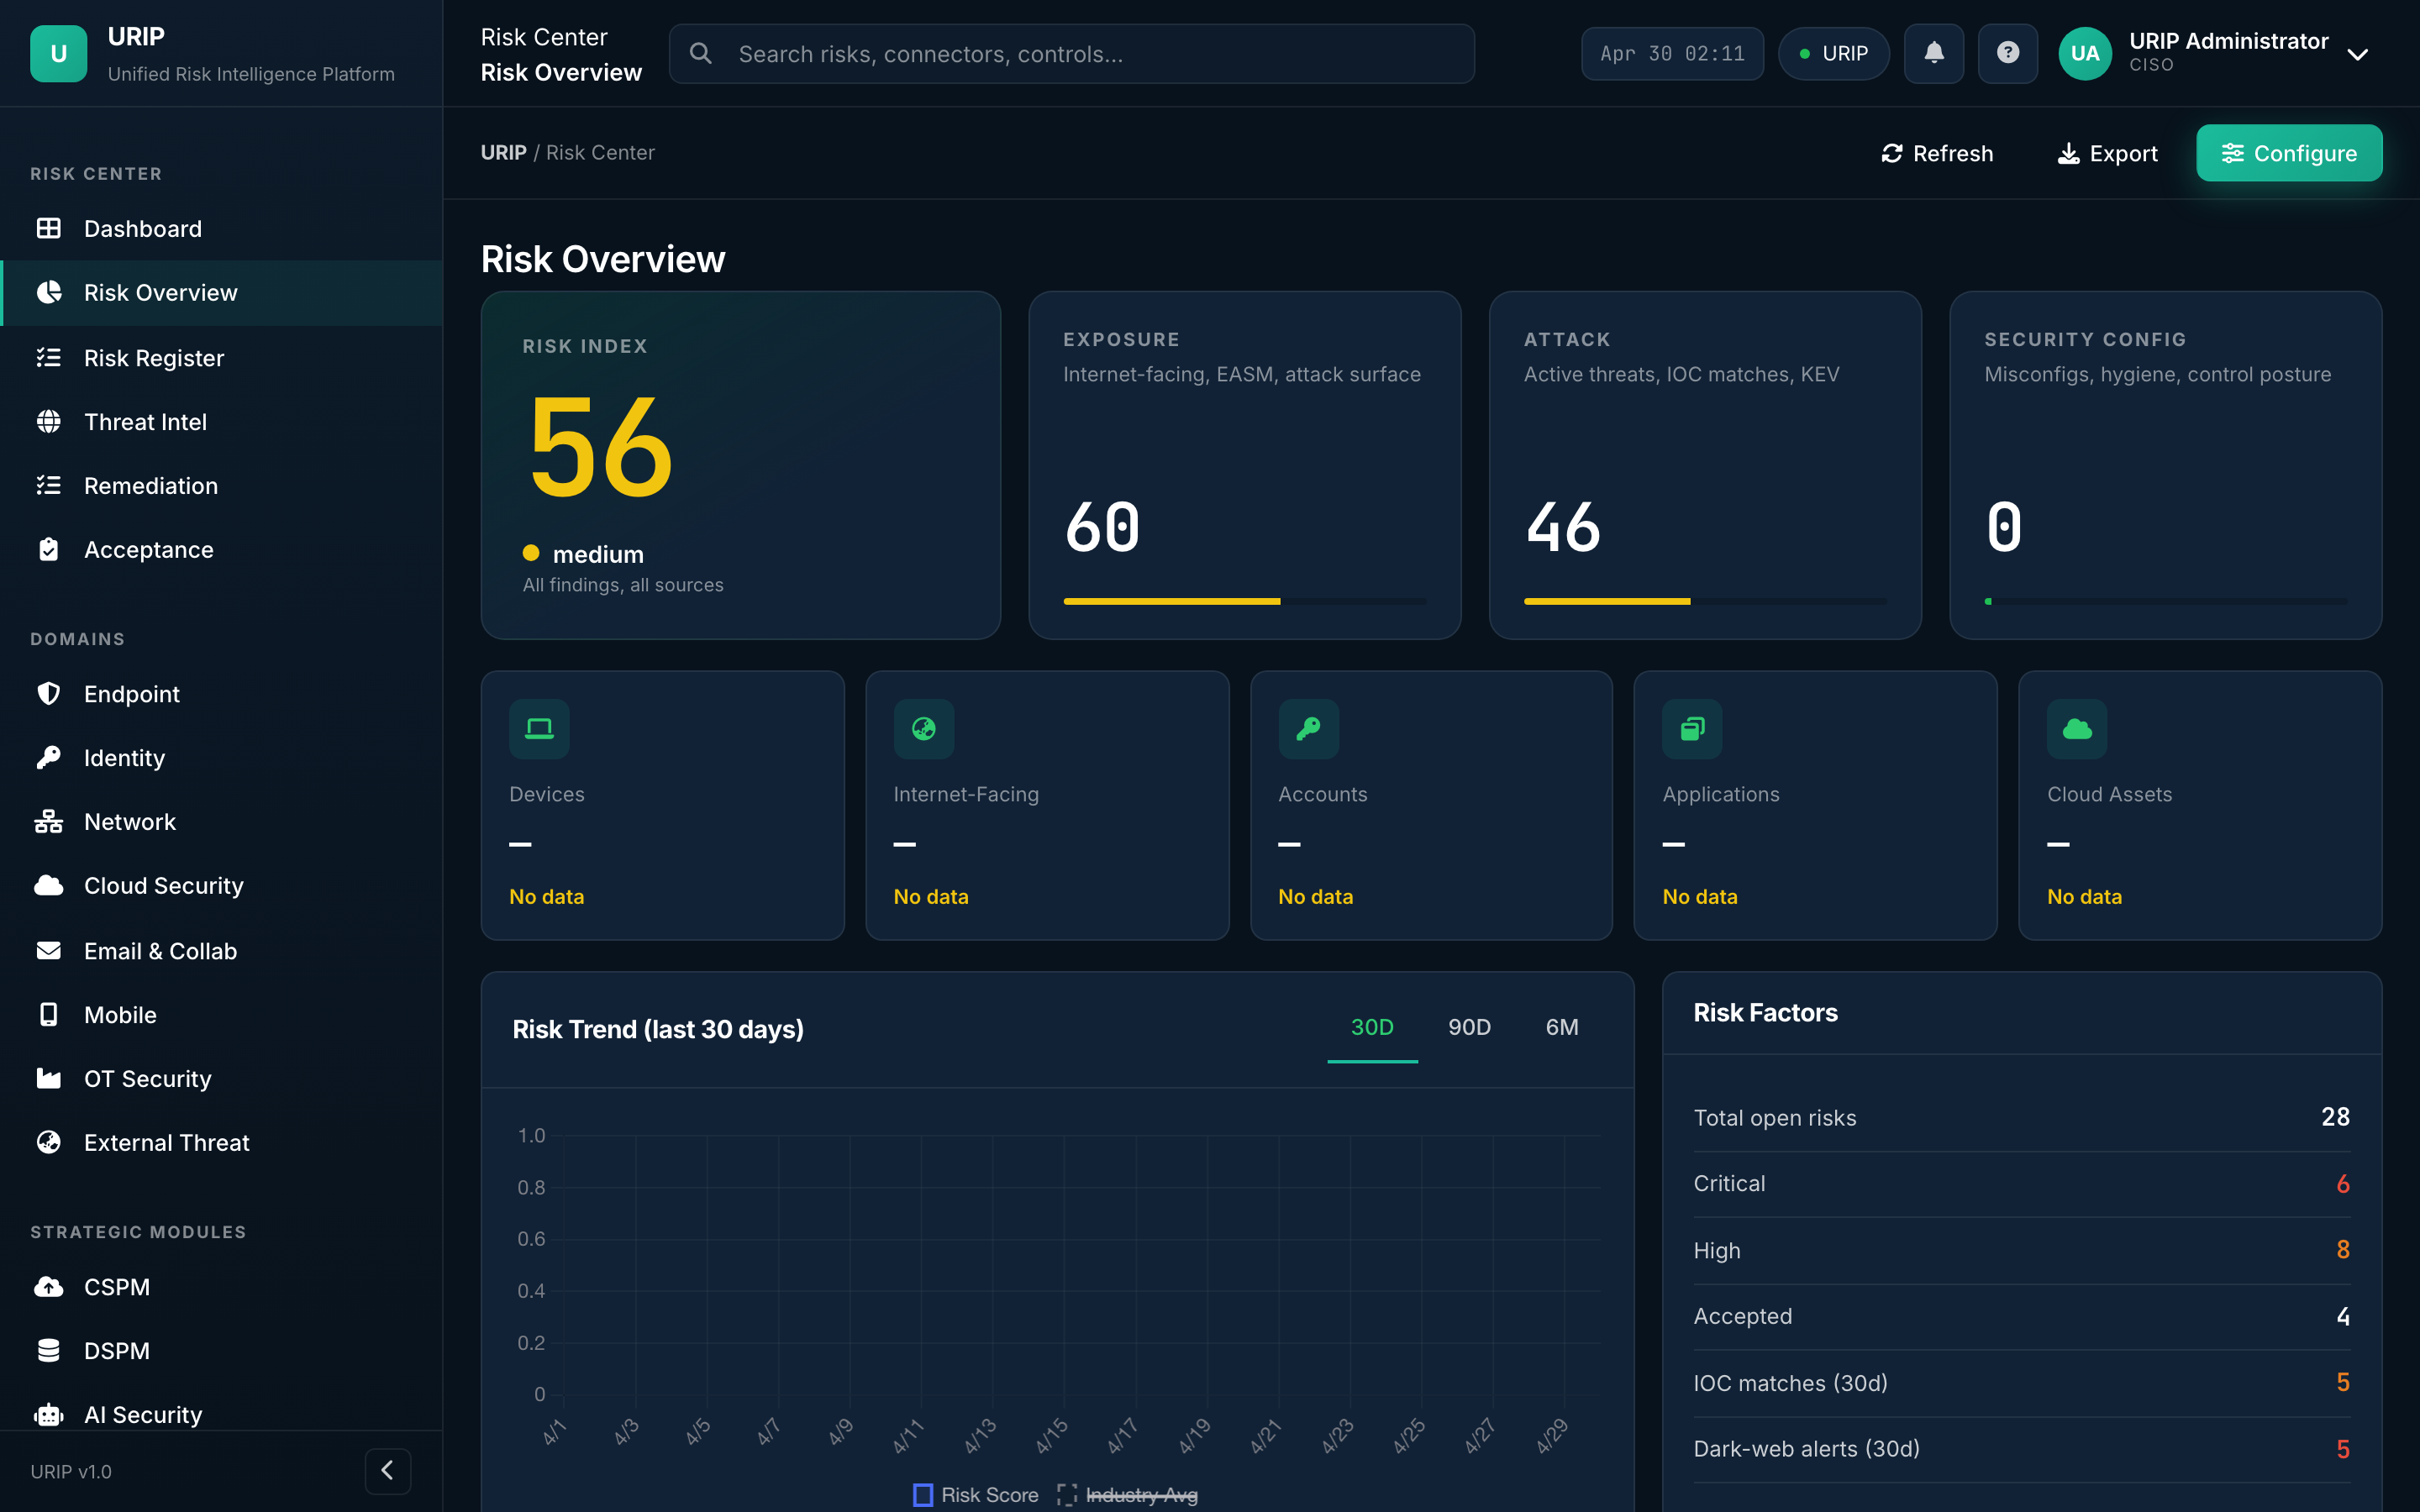
What it shows. Executive view of the entire risk surface — open vs closed, by severity, by domain, by source connector, by SLA bucket. Includes the 30/60/90-day trend lines and the "what changed today" delta strip.
What you do here. Brief the CISO from this single page; export it as a board-ready PDF.
Risk register
URL: /risk-register.html
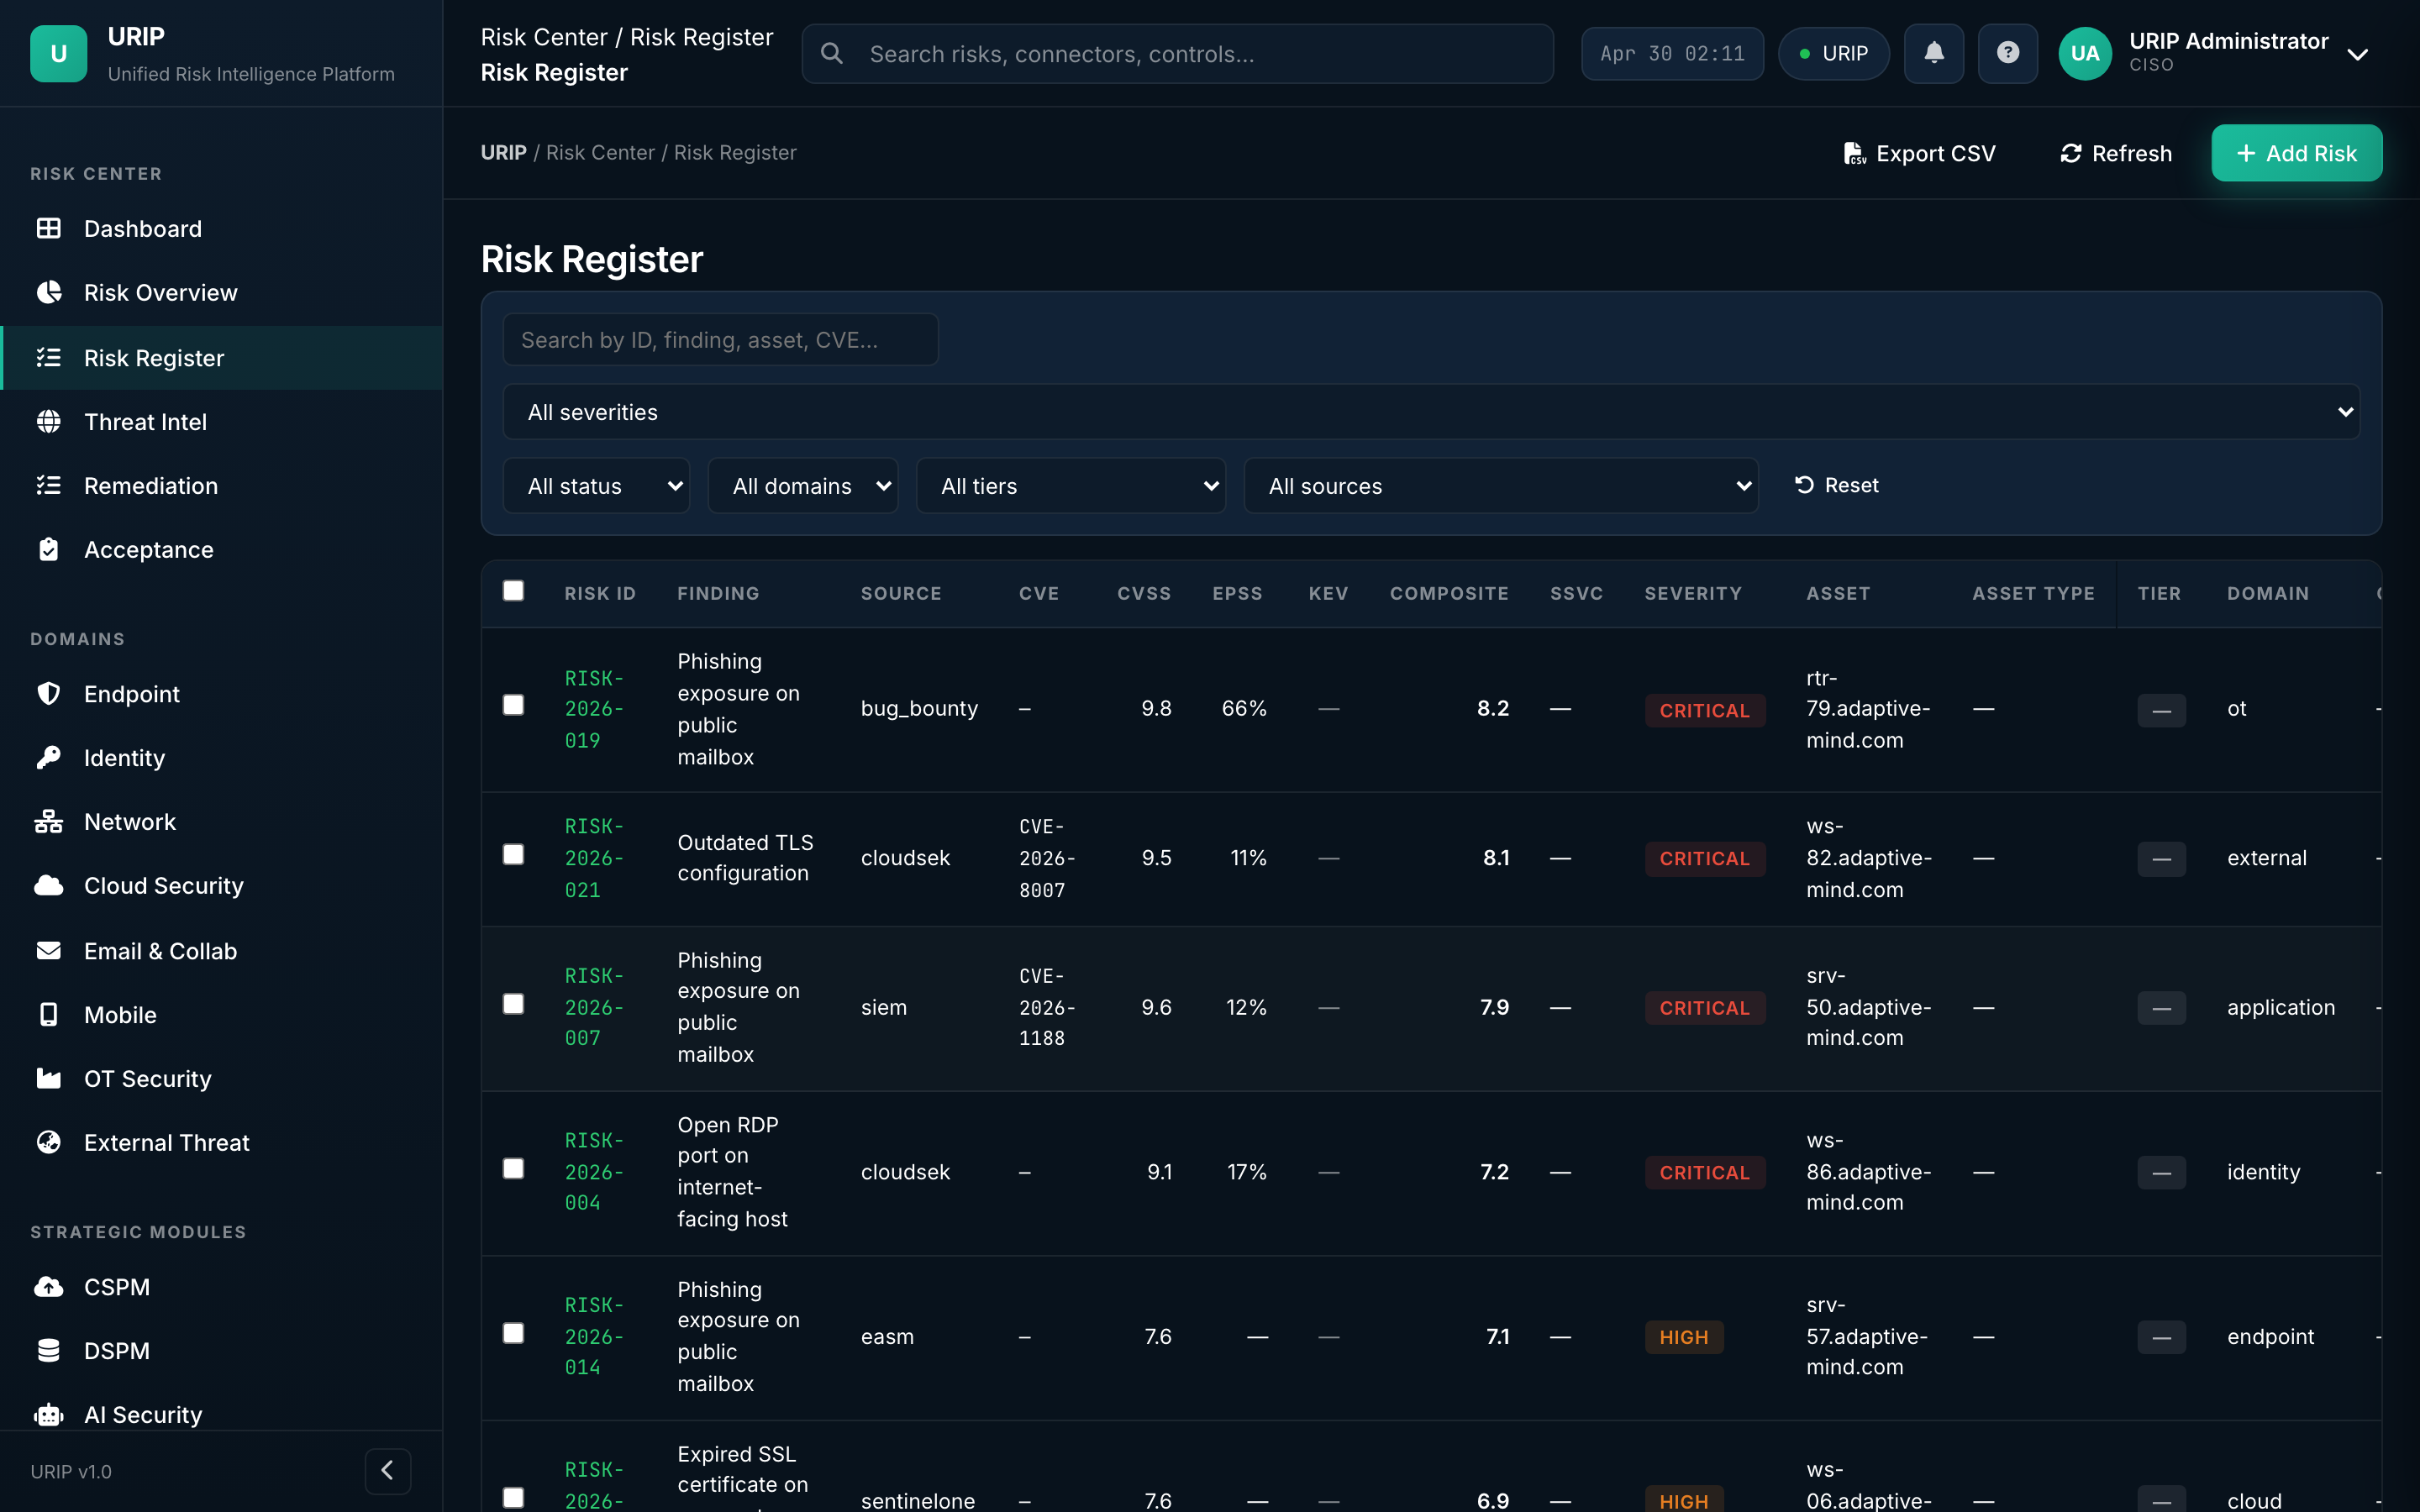
What it shows. The unified register — every finding from every connected tool, normalised to URIP's 0-10 score, enriched with EPSS / KEV / MITRE / OTX intelligence, and bucketed by status (Open, Triaged, In Progress, Accepted, Closed).
What you do here. Filter, search, bulk-assign, push to Jira / ServiceNow, accept-with-justification, or close with evidence.
Risk quantification (FAIR)
URL: /risk-quantification.html
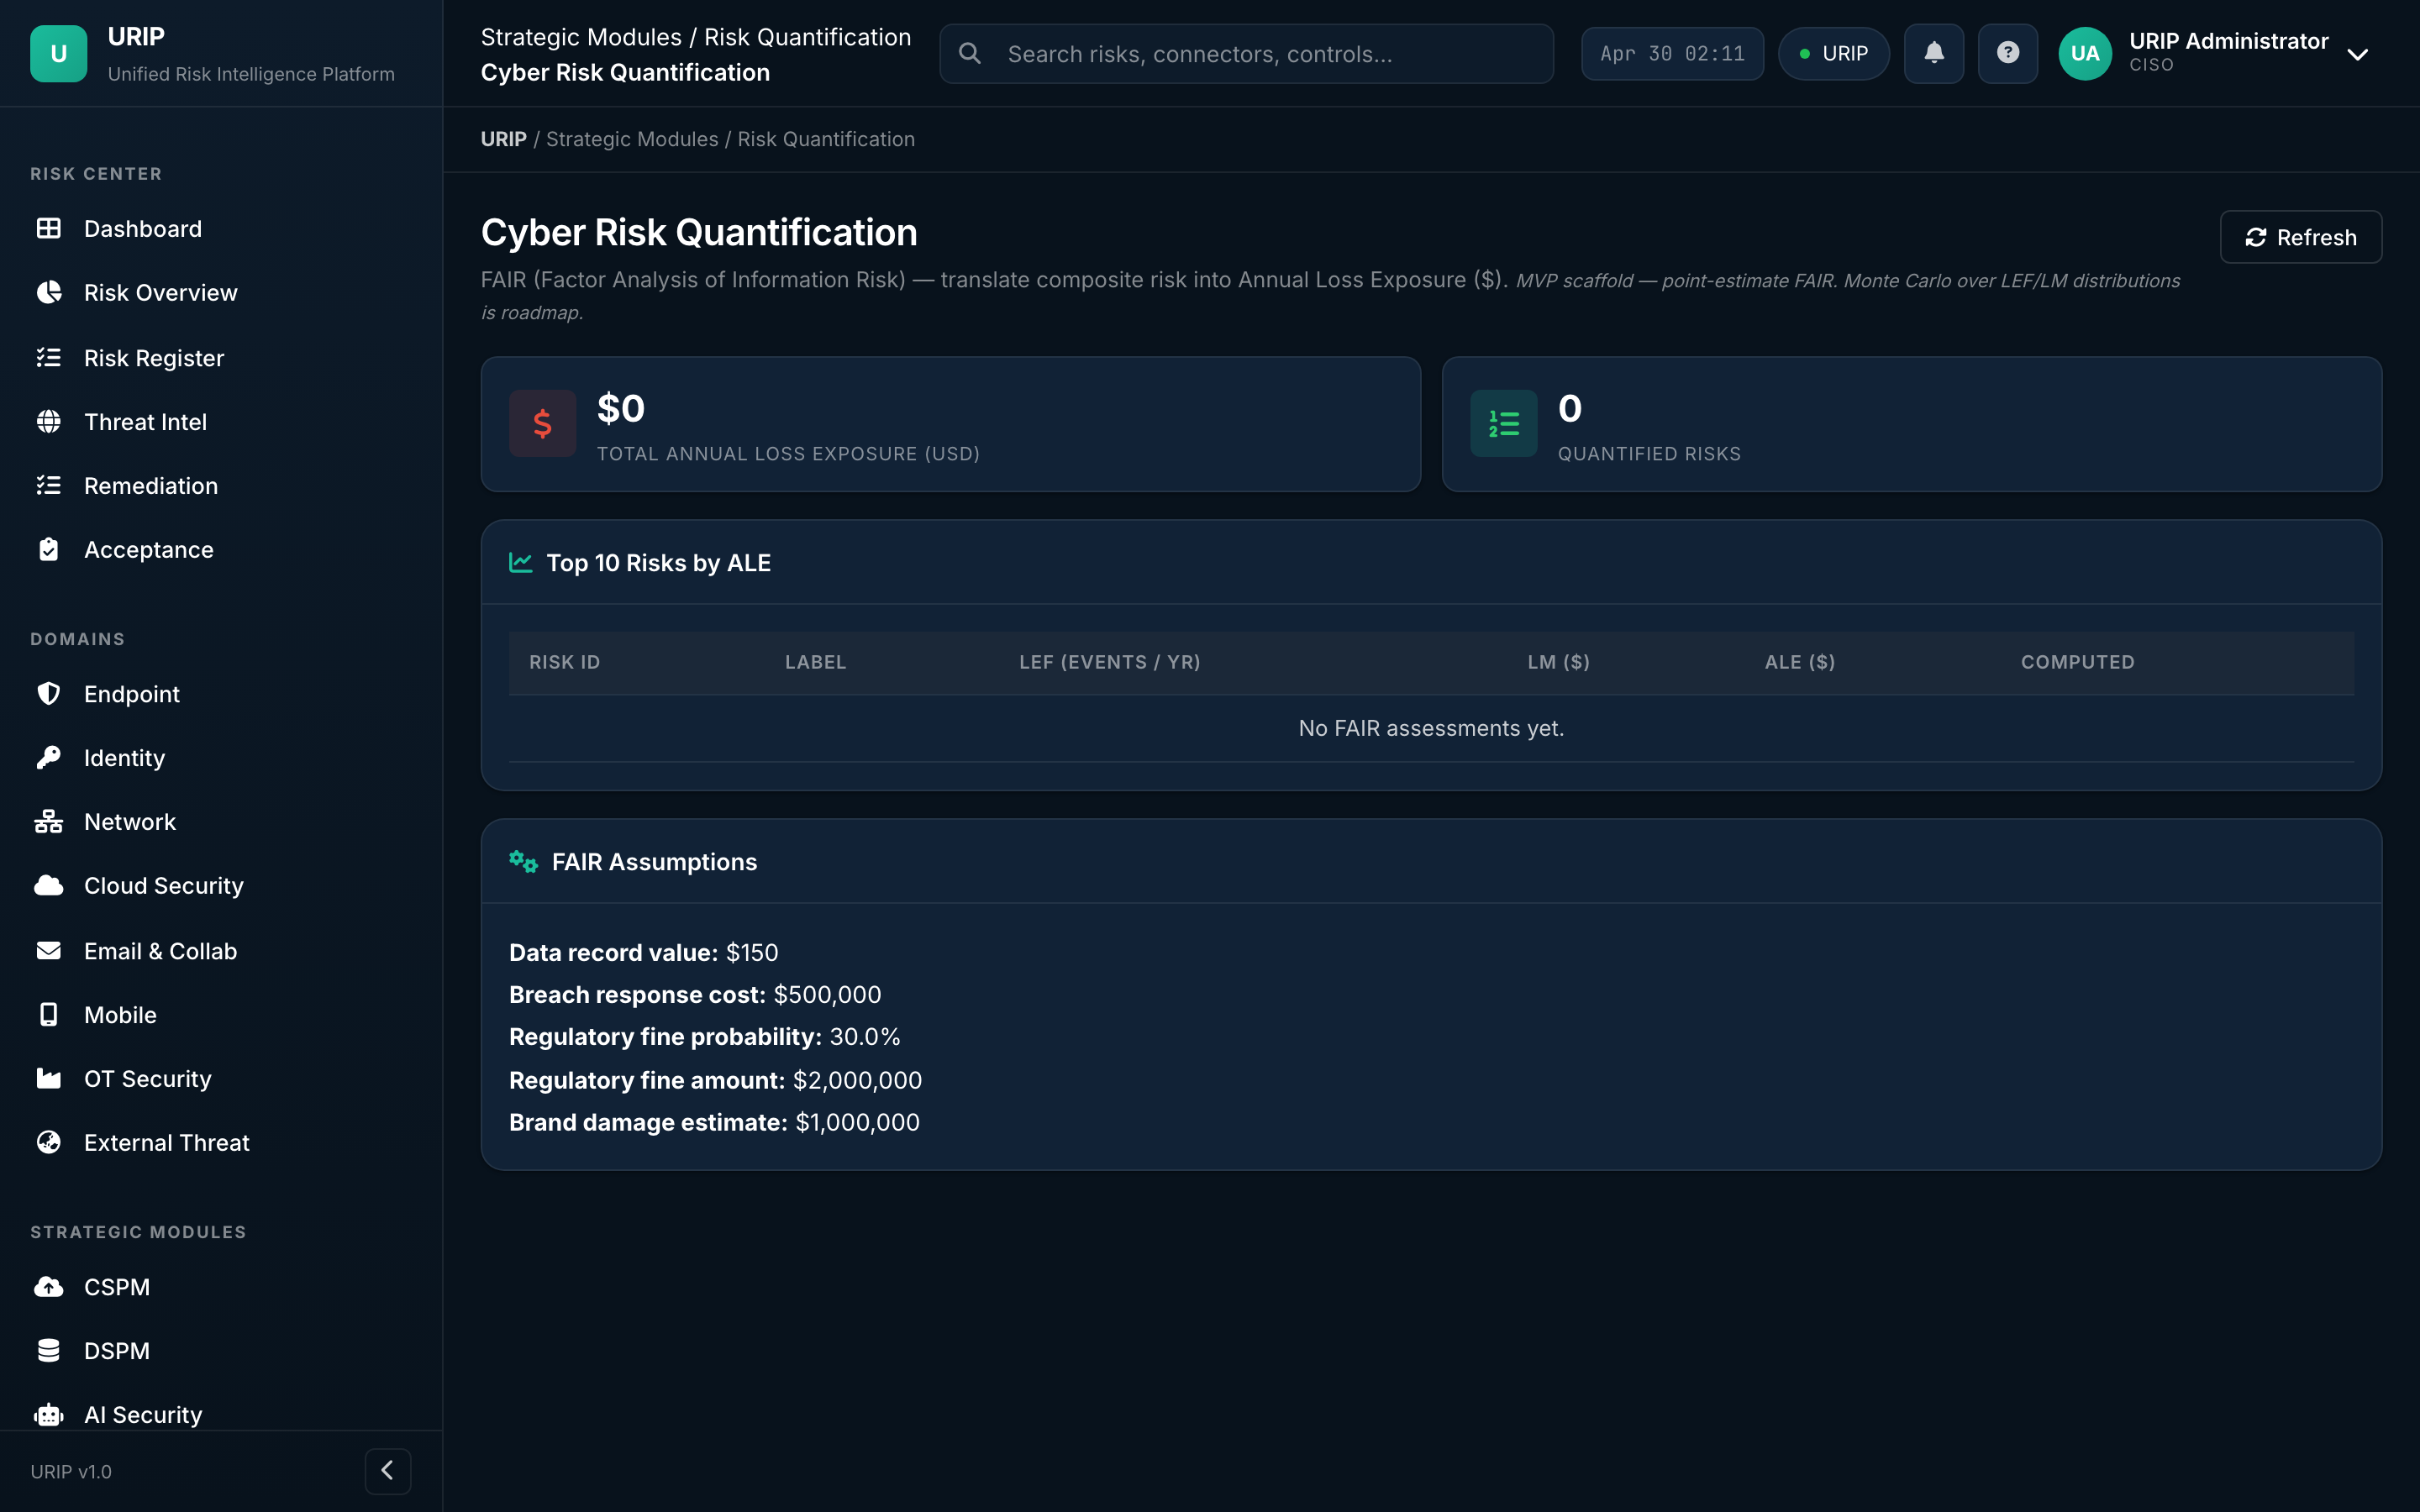
What it shows. Financial impact of every risk using the FAIR (Factor Analysis of Information Risk) model. Annualised loss expectancy ranges, Monte-Carlo distributions, and the cost-vs-fix-effort matrix that justifies tooling spend to the board.
What you do here. Pick the top 5 risks by ALE, model what mitigations would do to the loss-curve, screenshot for the budget meeting.
Attack path
URL: /attack-path.html
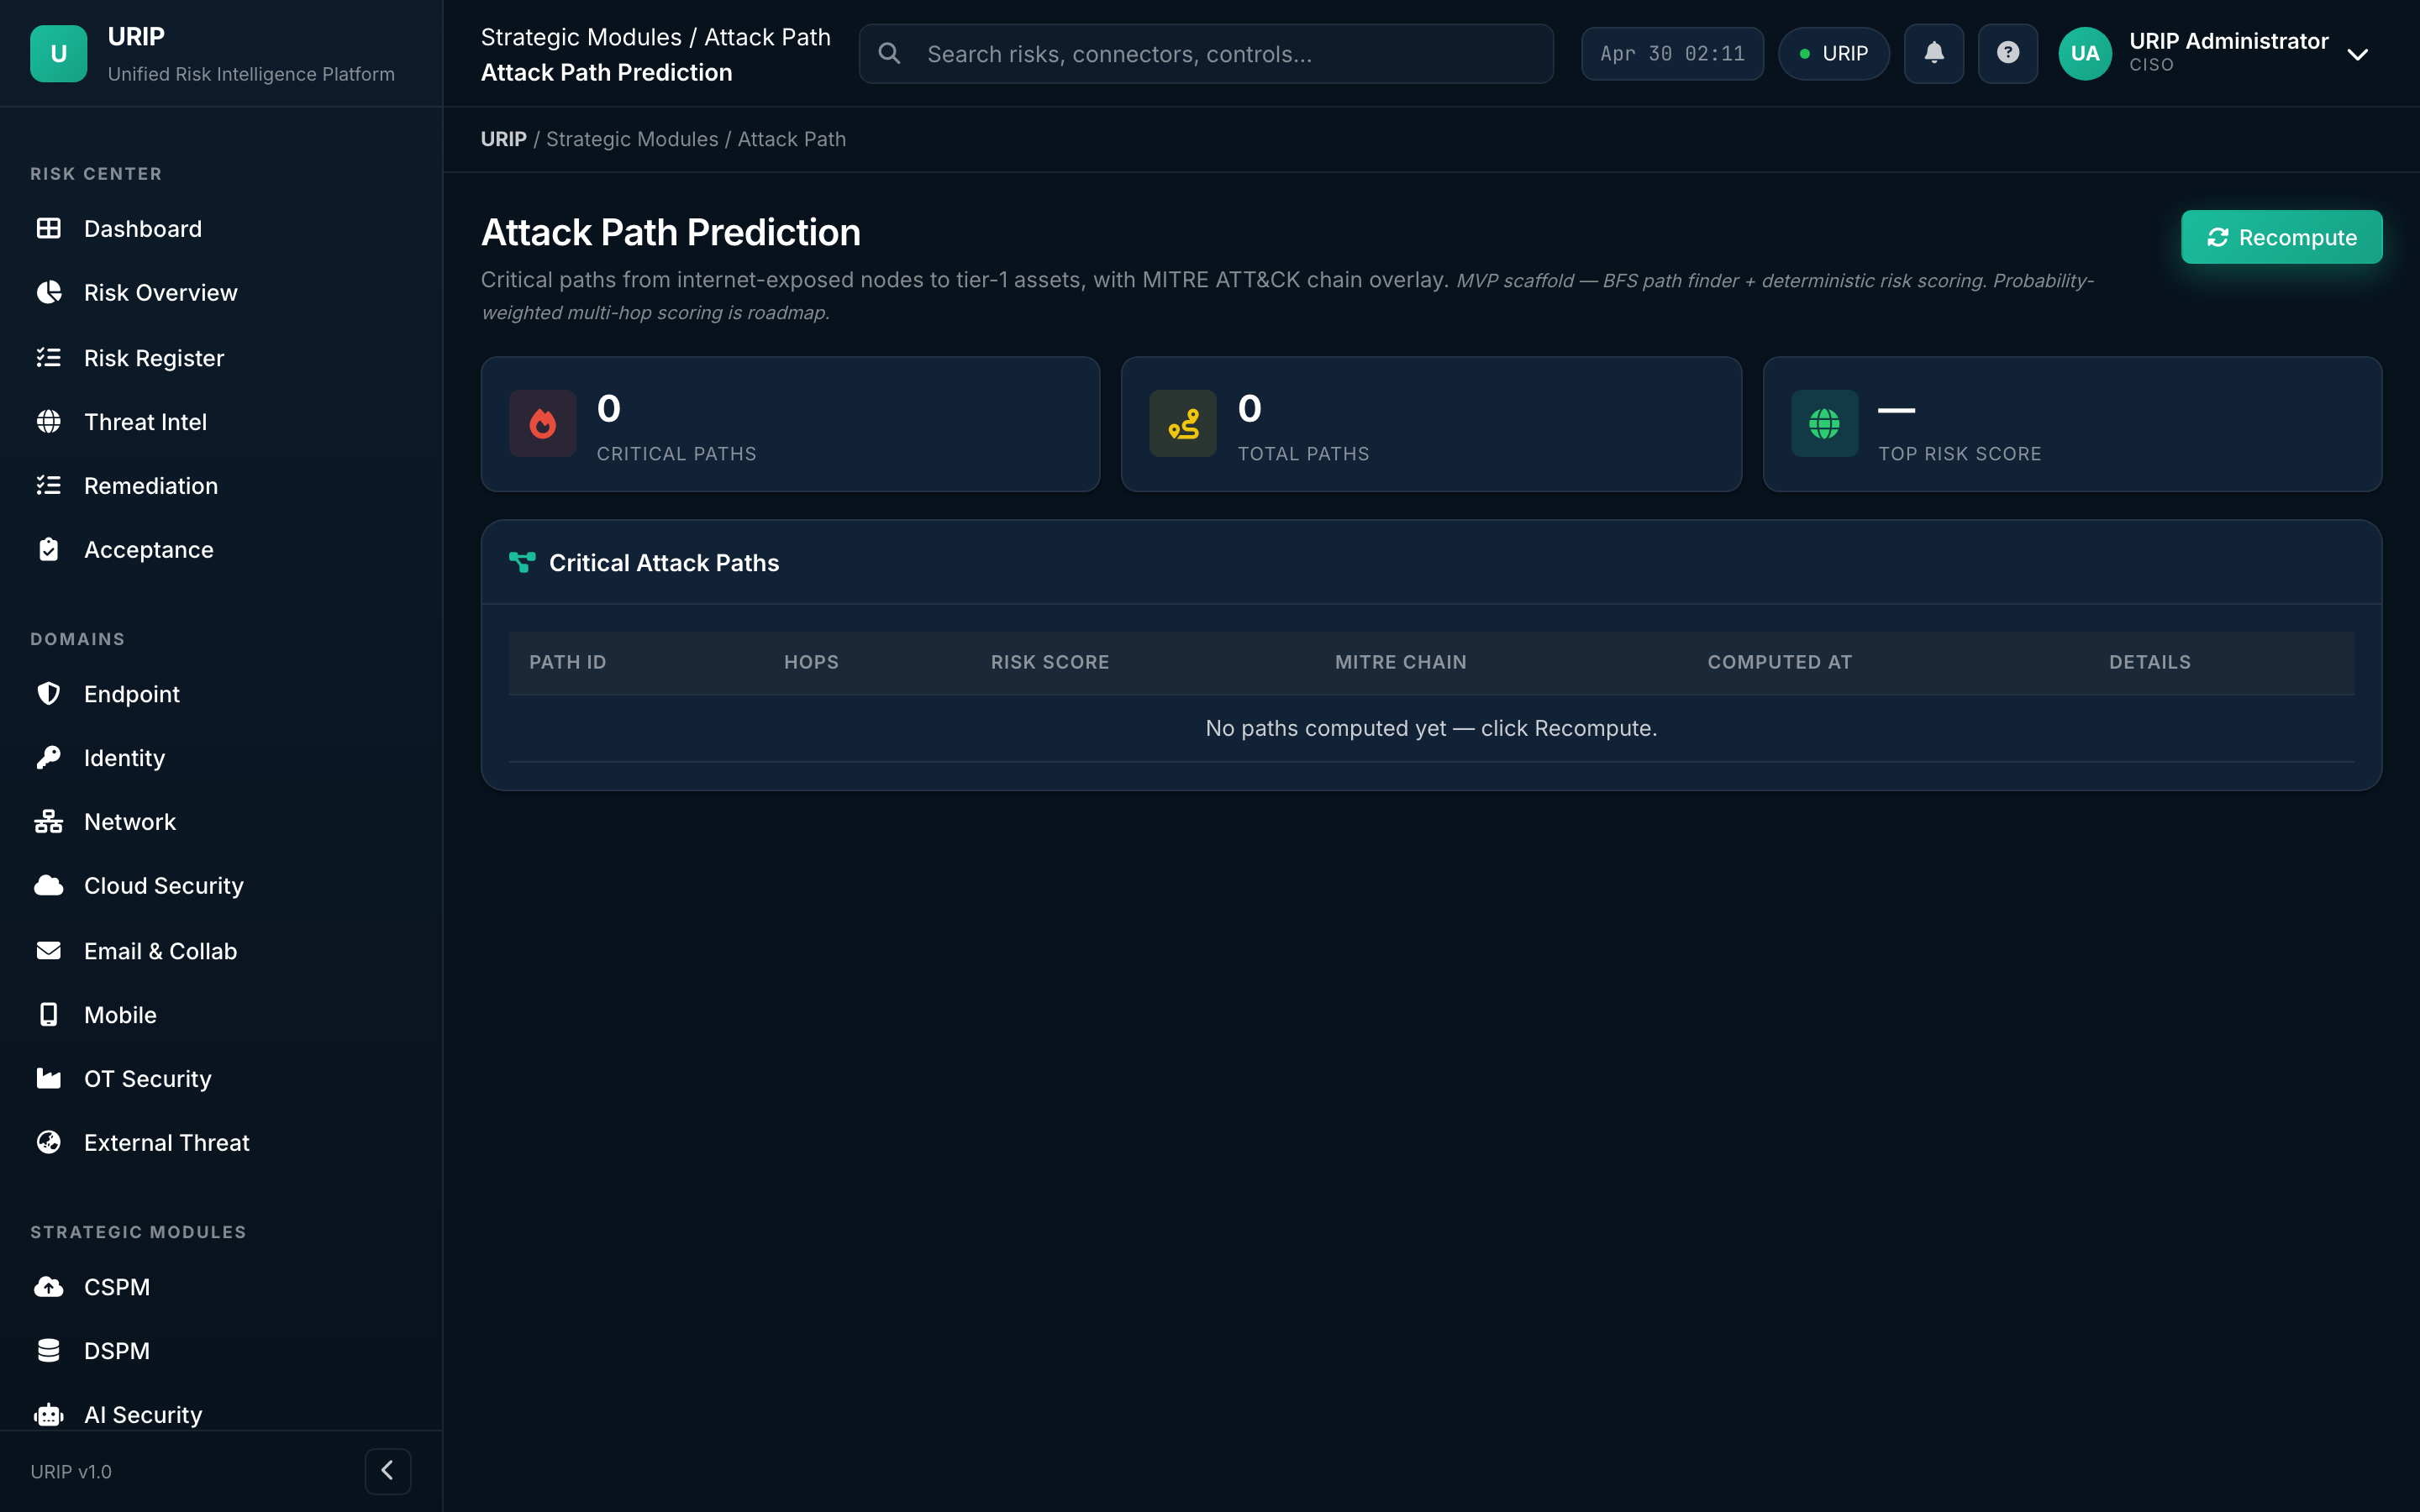
What it shows. Graph view linking each finding to the assets it touches and the assets those assets connect to — visualising how an attacker would chain low-severity findings into a high-impact compromise. Color-coded by MITRE ATT&CK tactic.
What you do here. Find the choke points — fix the one node that breaks the most paths.
Remediation tracker
URL: /remediation-tracker.html
![]()
What it shows. Every fix in flight — owner, due date, ticket link (Jira / ServiceNow / GitHub), SLA status (on-track / at-risk / breached), evidence required for closure.
What you do here. Stand-up driver. Filter to your team → see who's overdue → nudge.
Risk acceptance workflow
URL: /acceptance-workflow.html
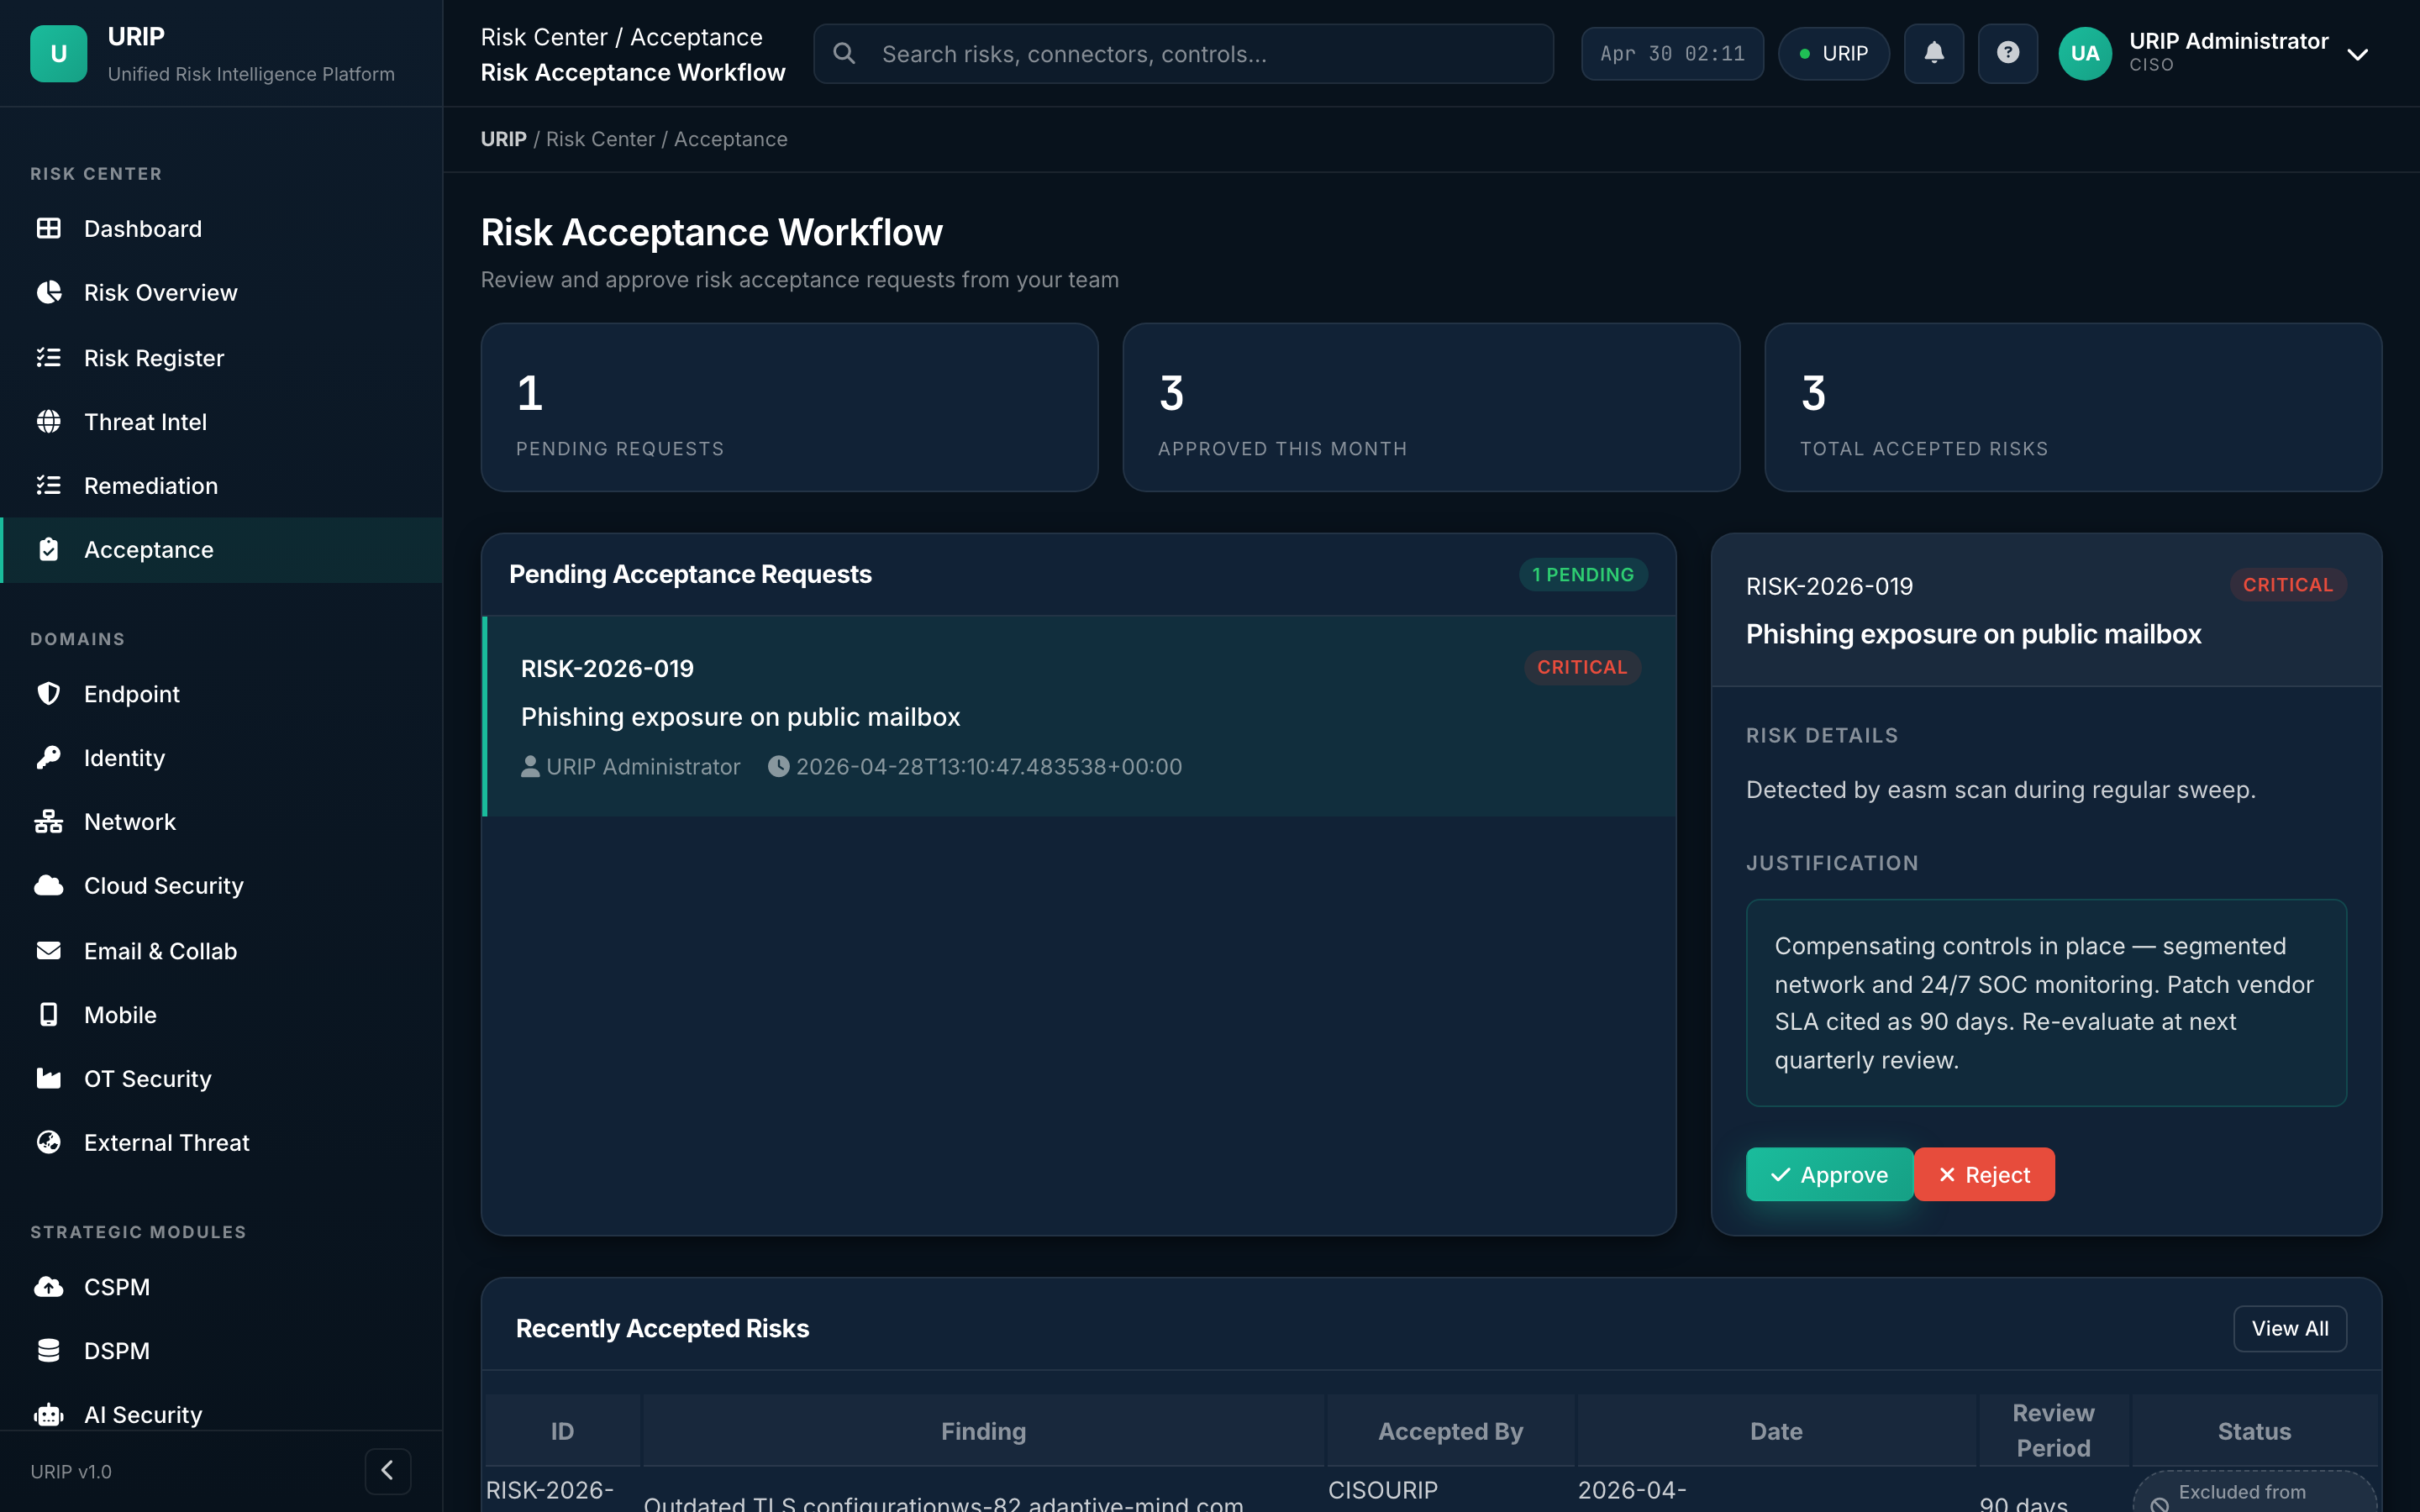
What it shows. Formal approval queue for risks the business decides to accept rather than fix. Captures justification, owner, expiry date, and approver chain — all stamped into the audit log.
What you do here. Submit an acceptance, escalate for sign-off, set the auto-review date.
Reports
URL: /reports.html
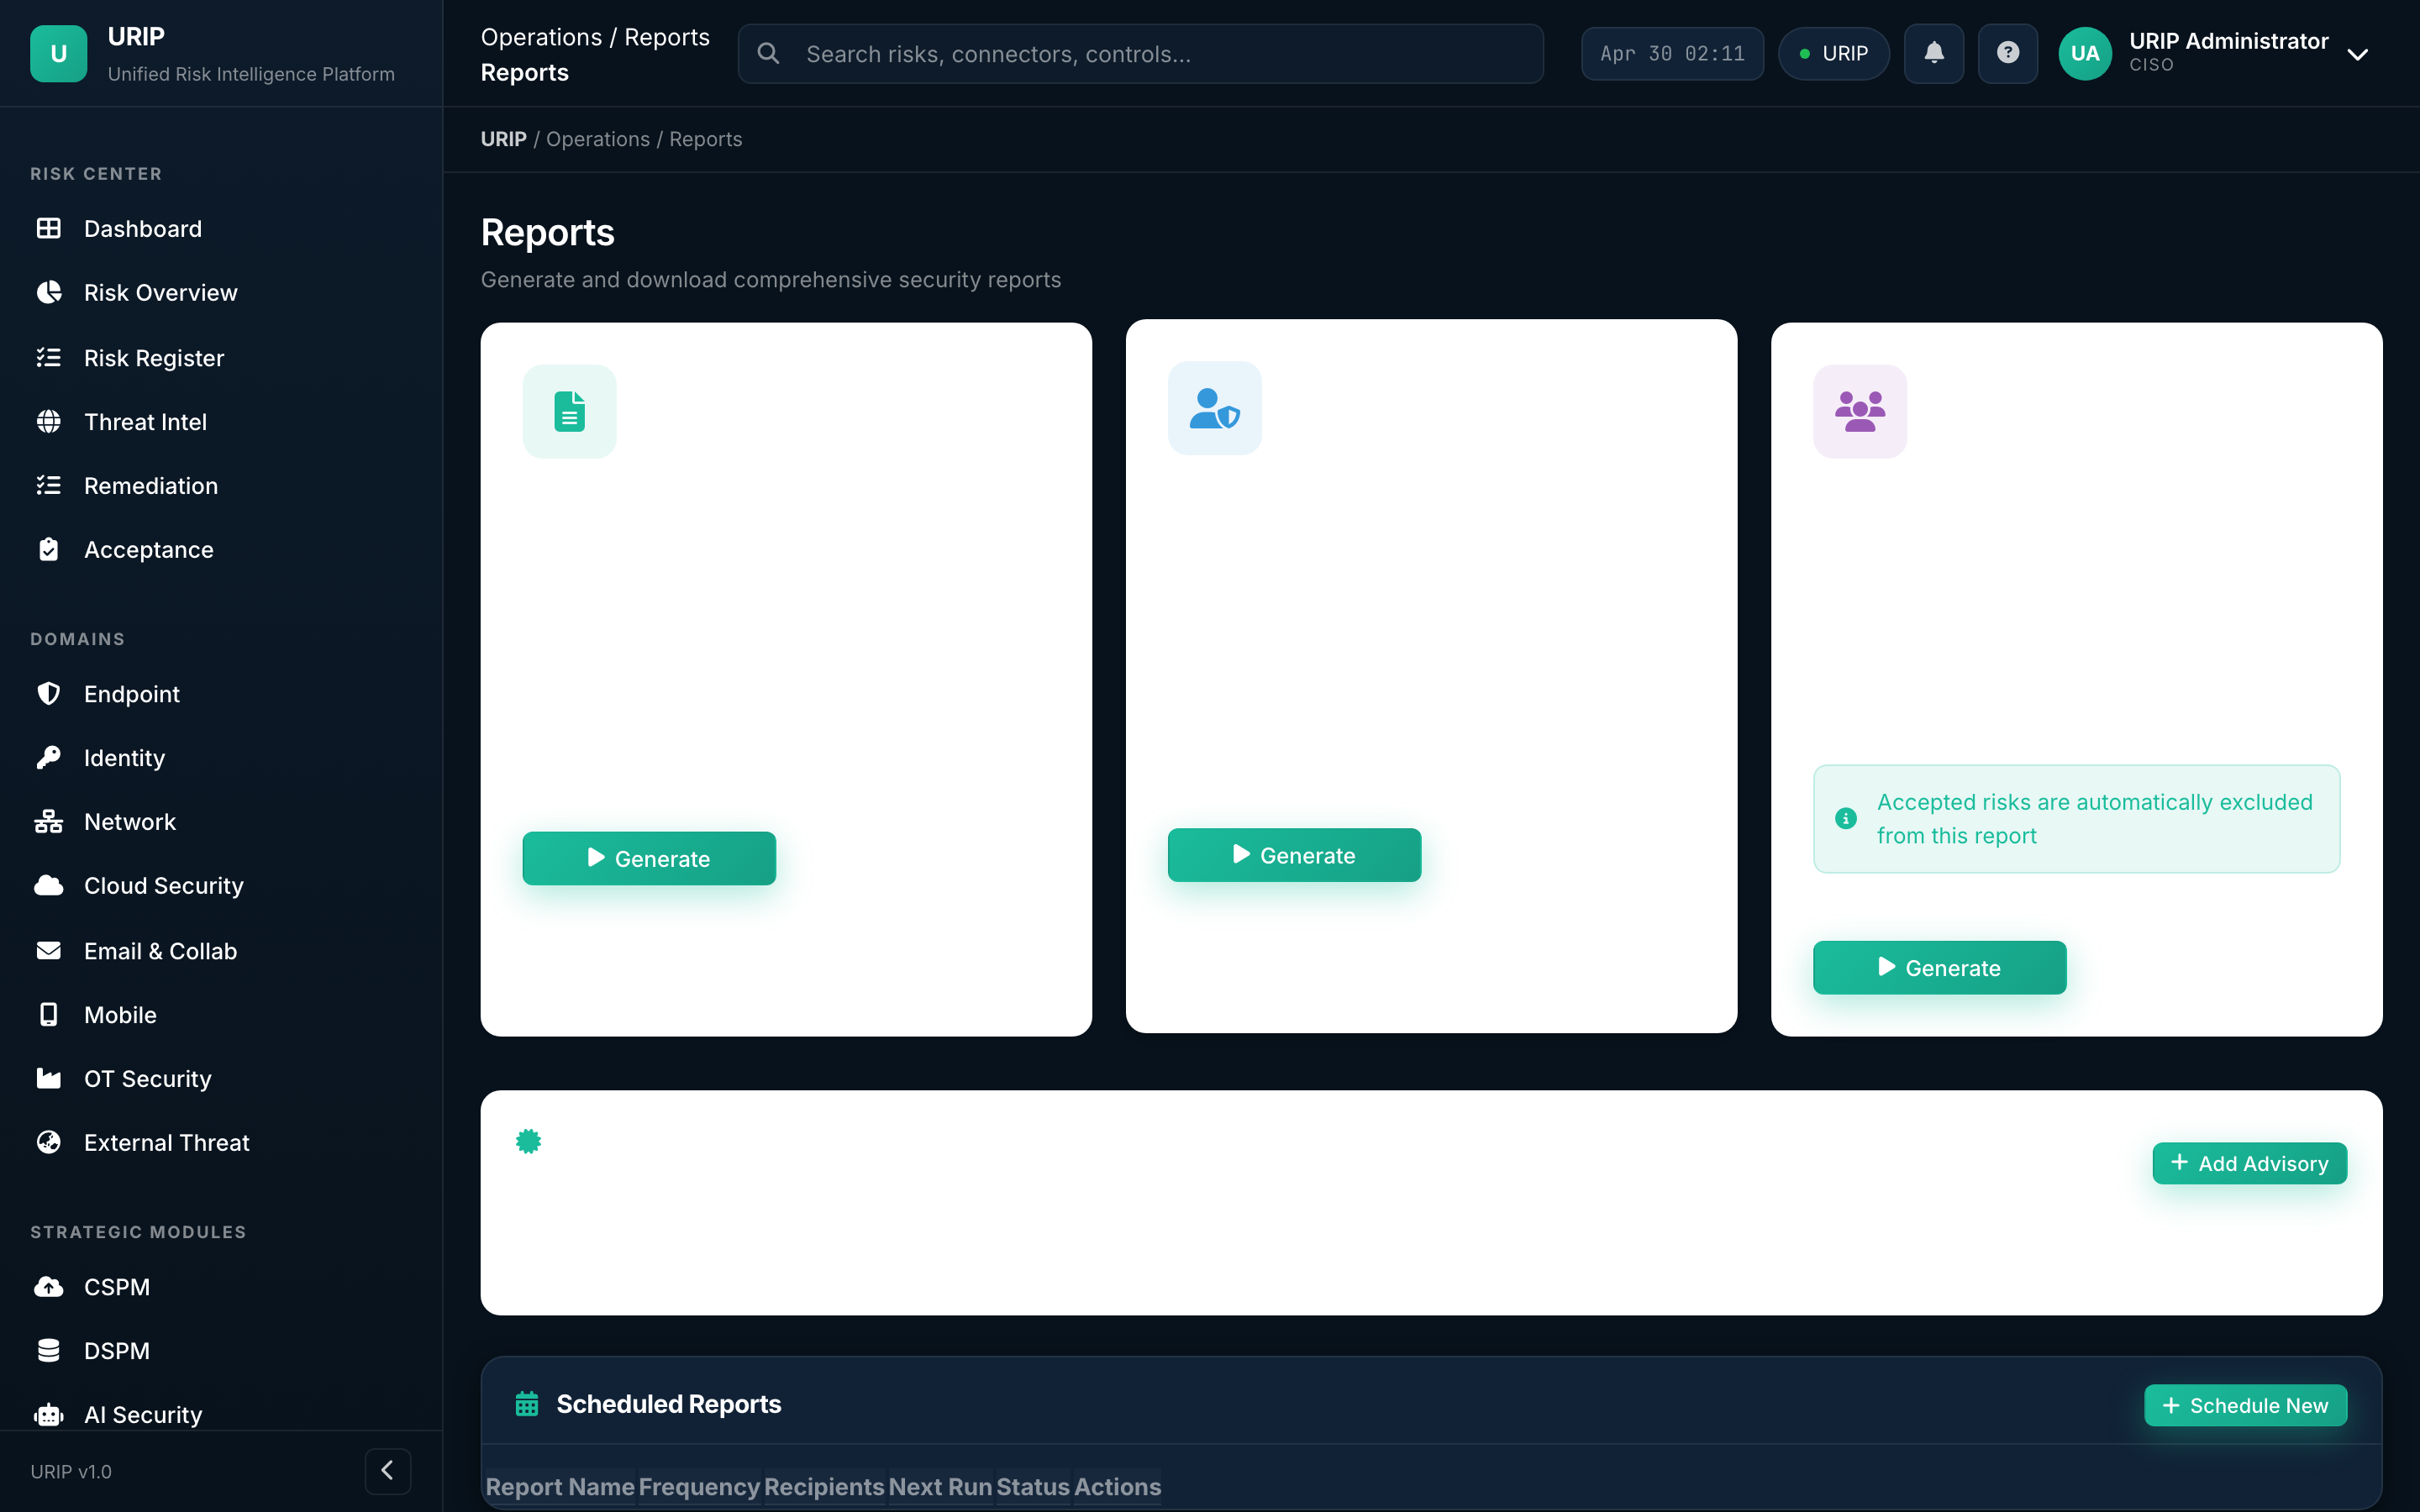
What it shows. Pre-built and scheduled reports — board pack (PDF), audit evidence pack (ZIP), monthly KEV exposure, SLA-breach summary, vendor risk roll-up.
What you do here. Trigger ad-hoc, schedule recurring, or download the most recent run.
Threat map
URL: /threat-map.html
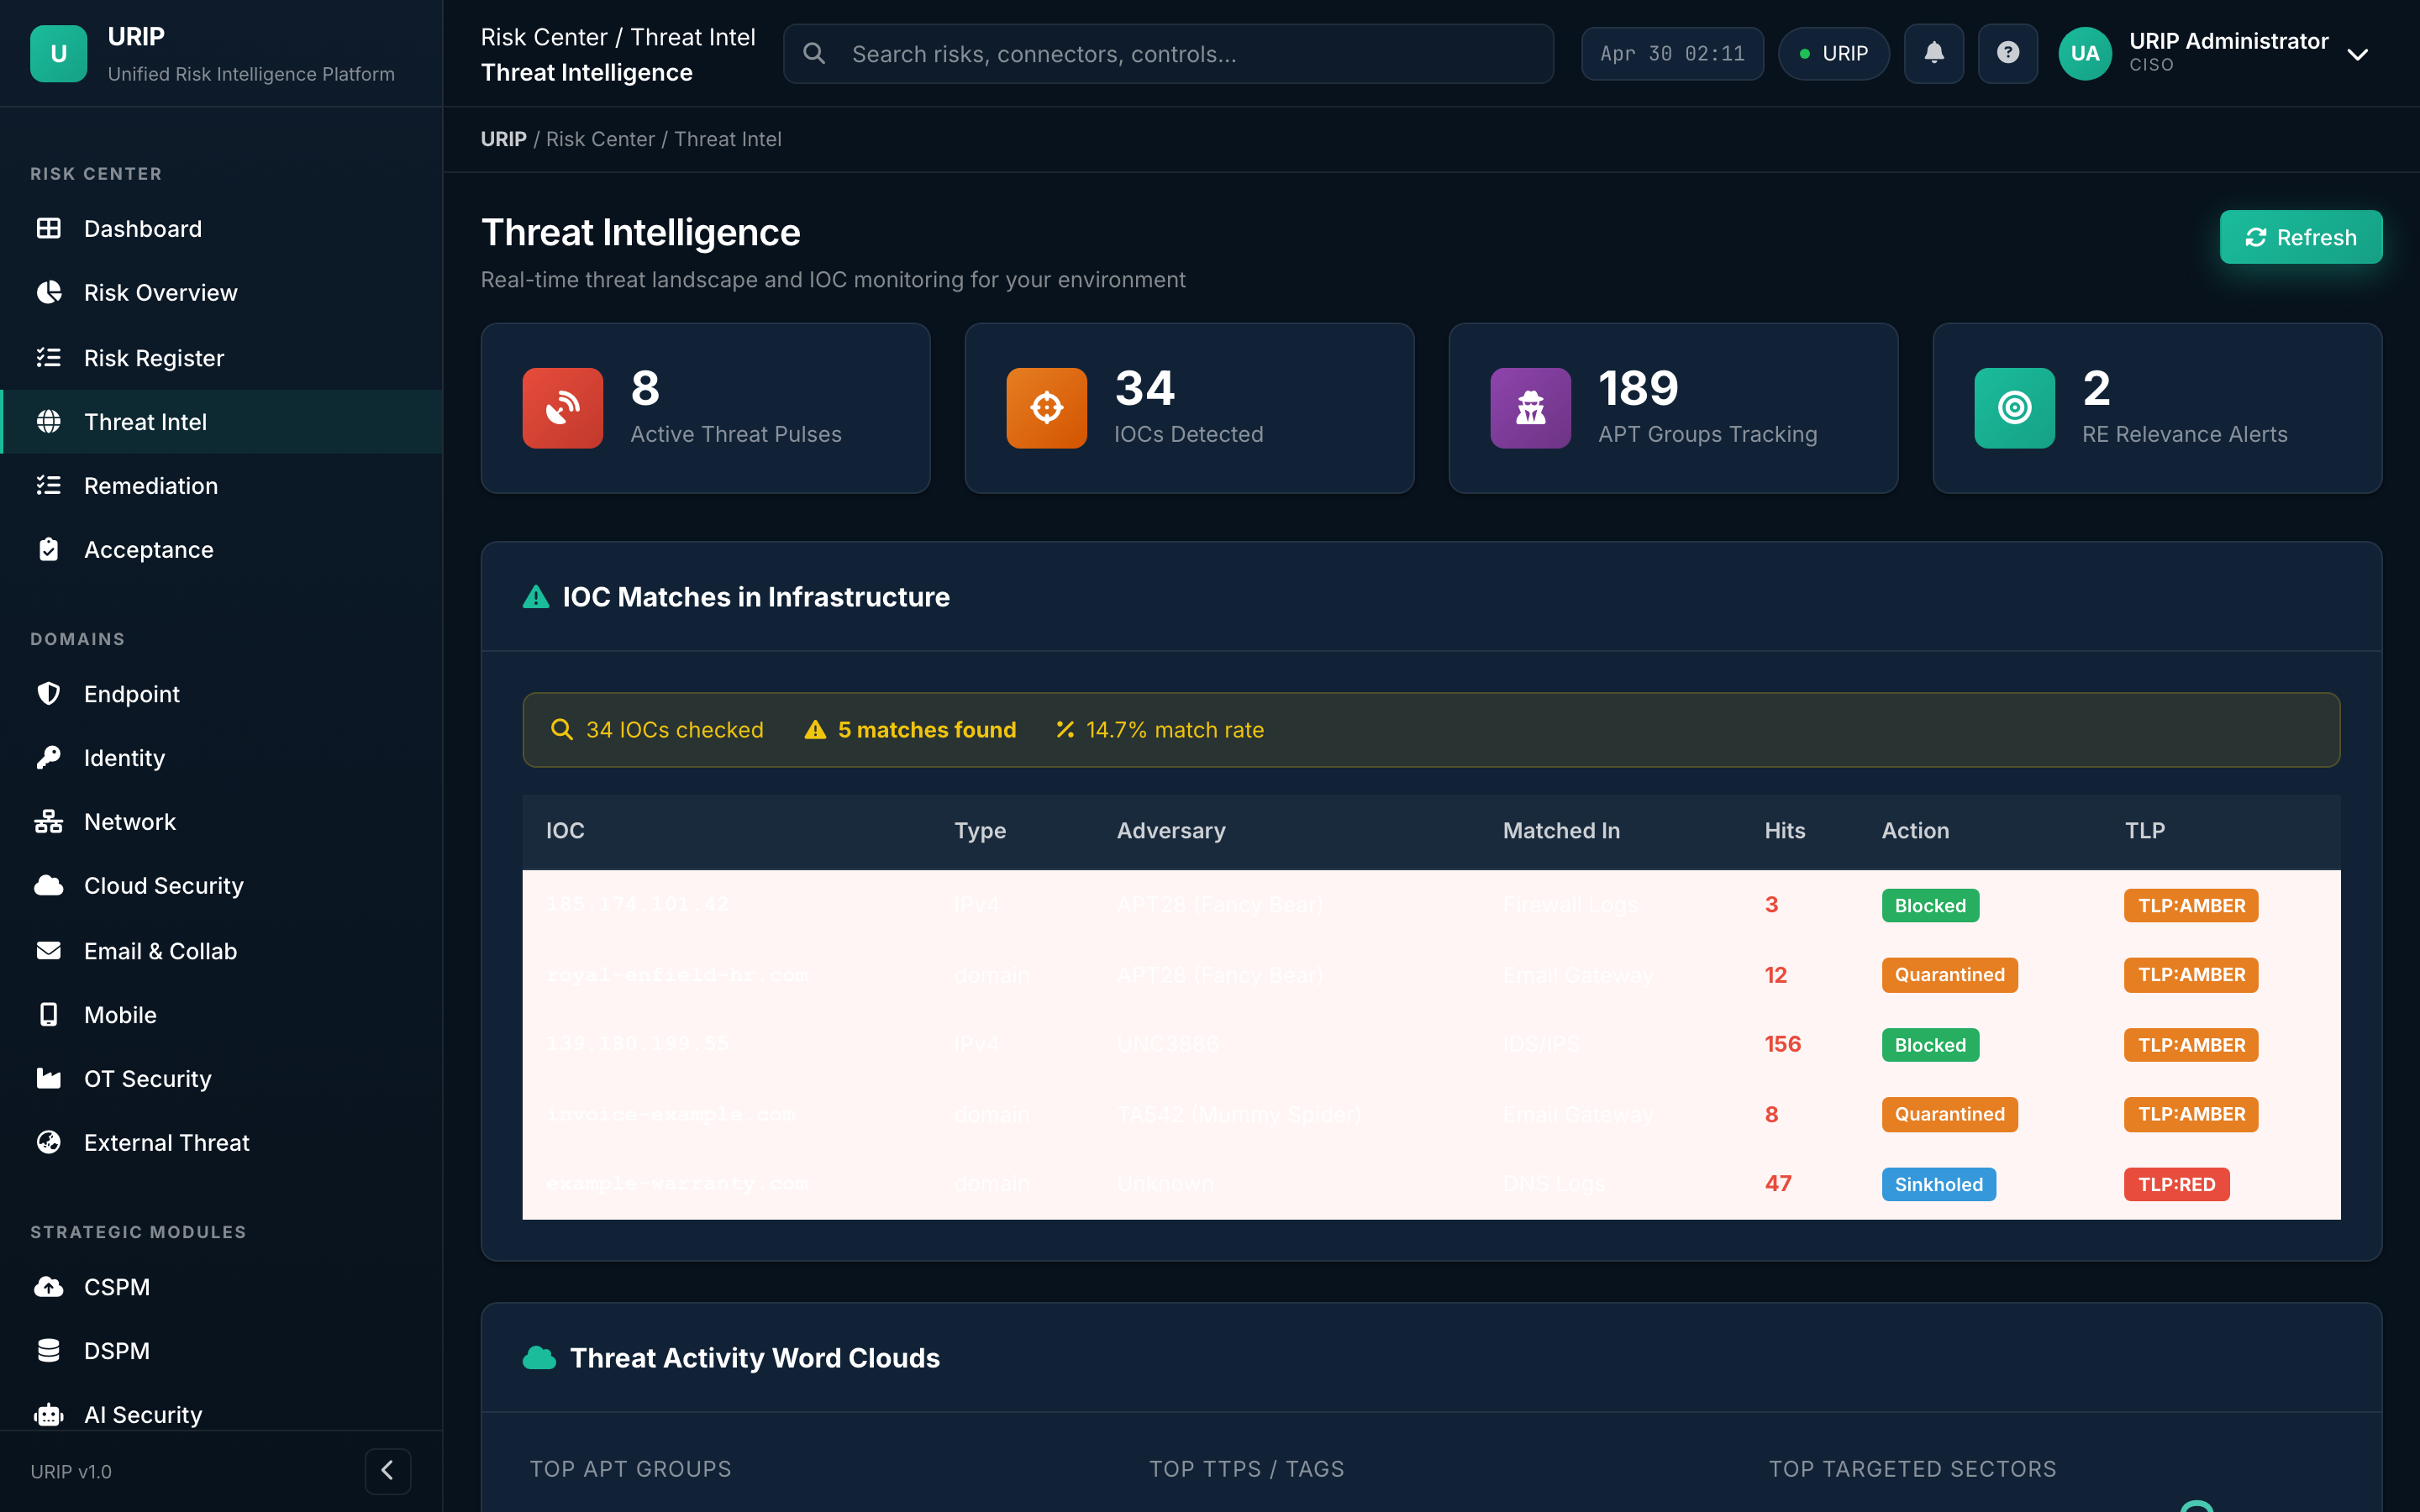
What it shows. Geographic heat map of threat-actor activity hitting your perimeter — sourced from AlienVault OTX, MITRE ATT&CK groups, and your own SIEM signal.
What you do here. See where the noise is loudest today; correlate with travel-risk advisories or country-of-origin policies.
4. Strategic modules
Optional modules — license per module. Visible only if your tenant has subscribed.
CSPM dashboard
URL: /cspm-dashboard.html
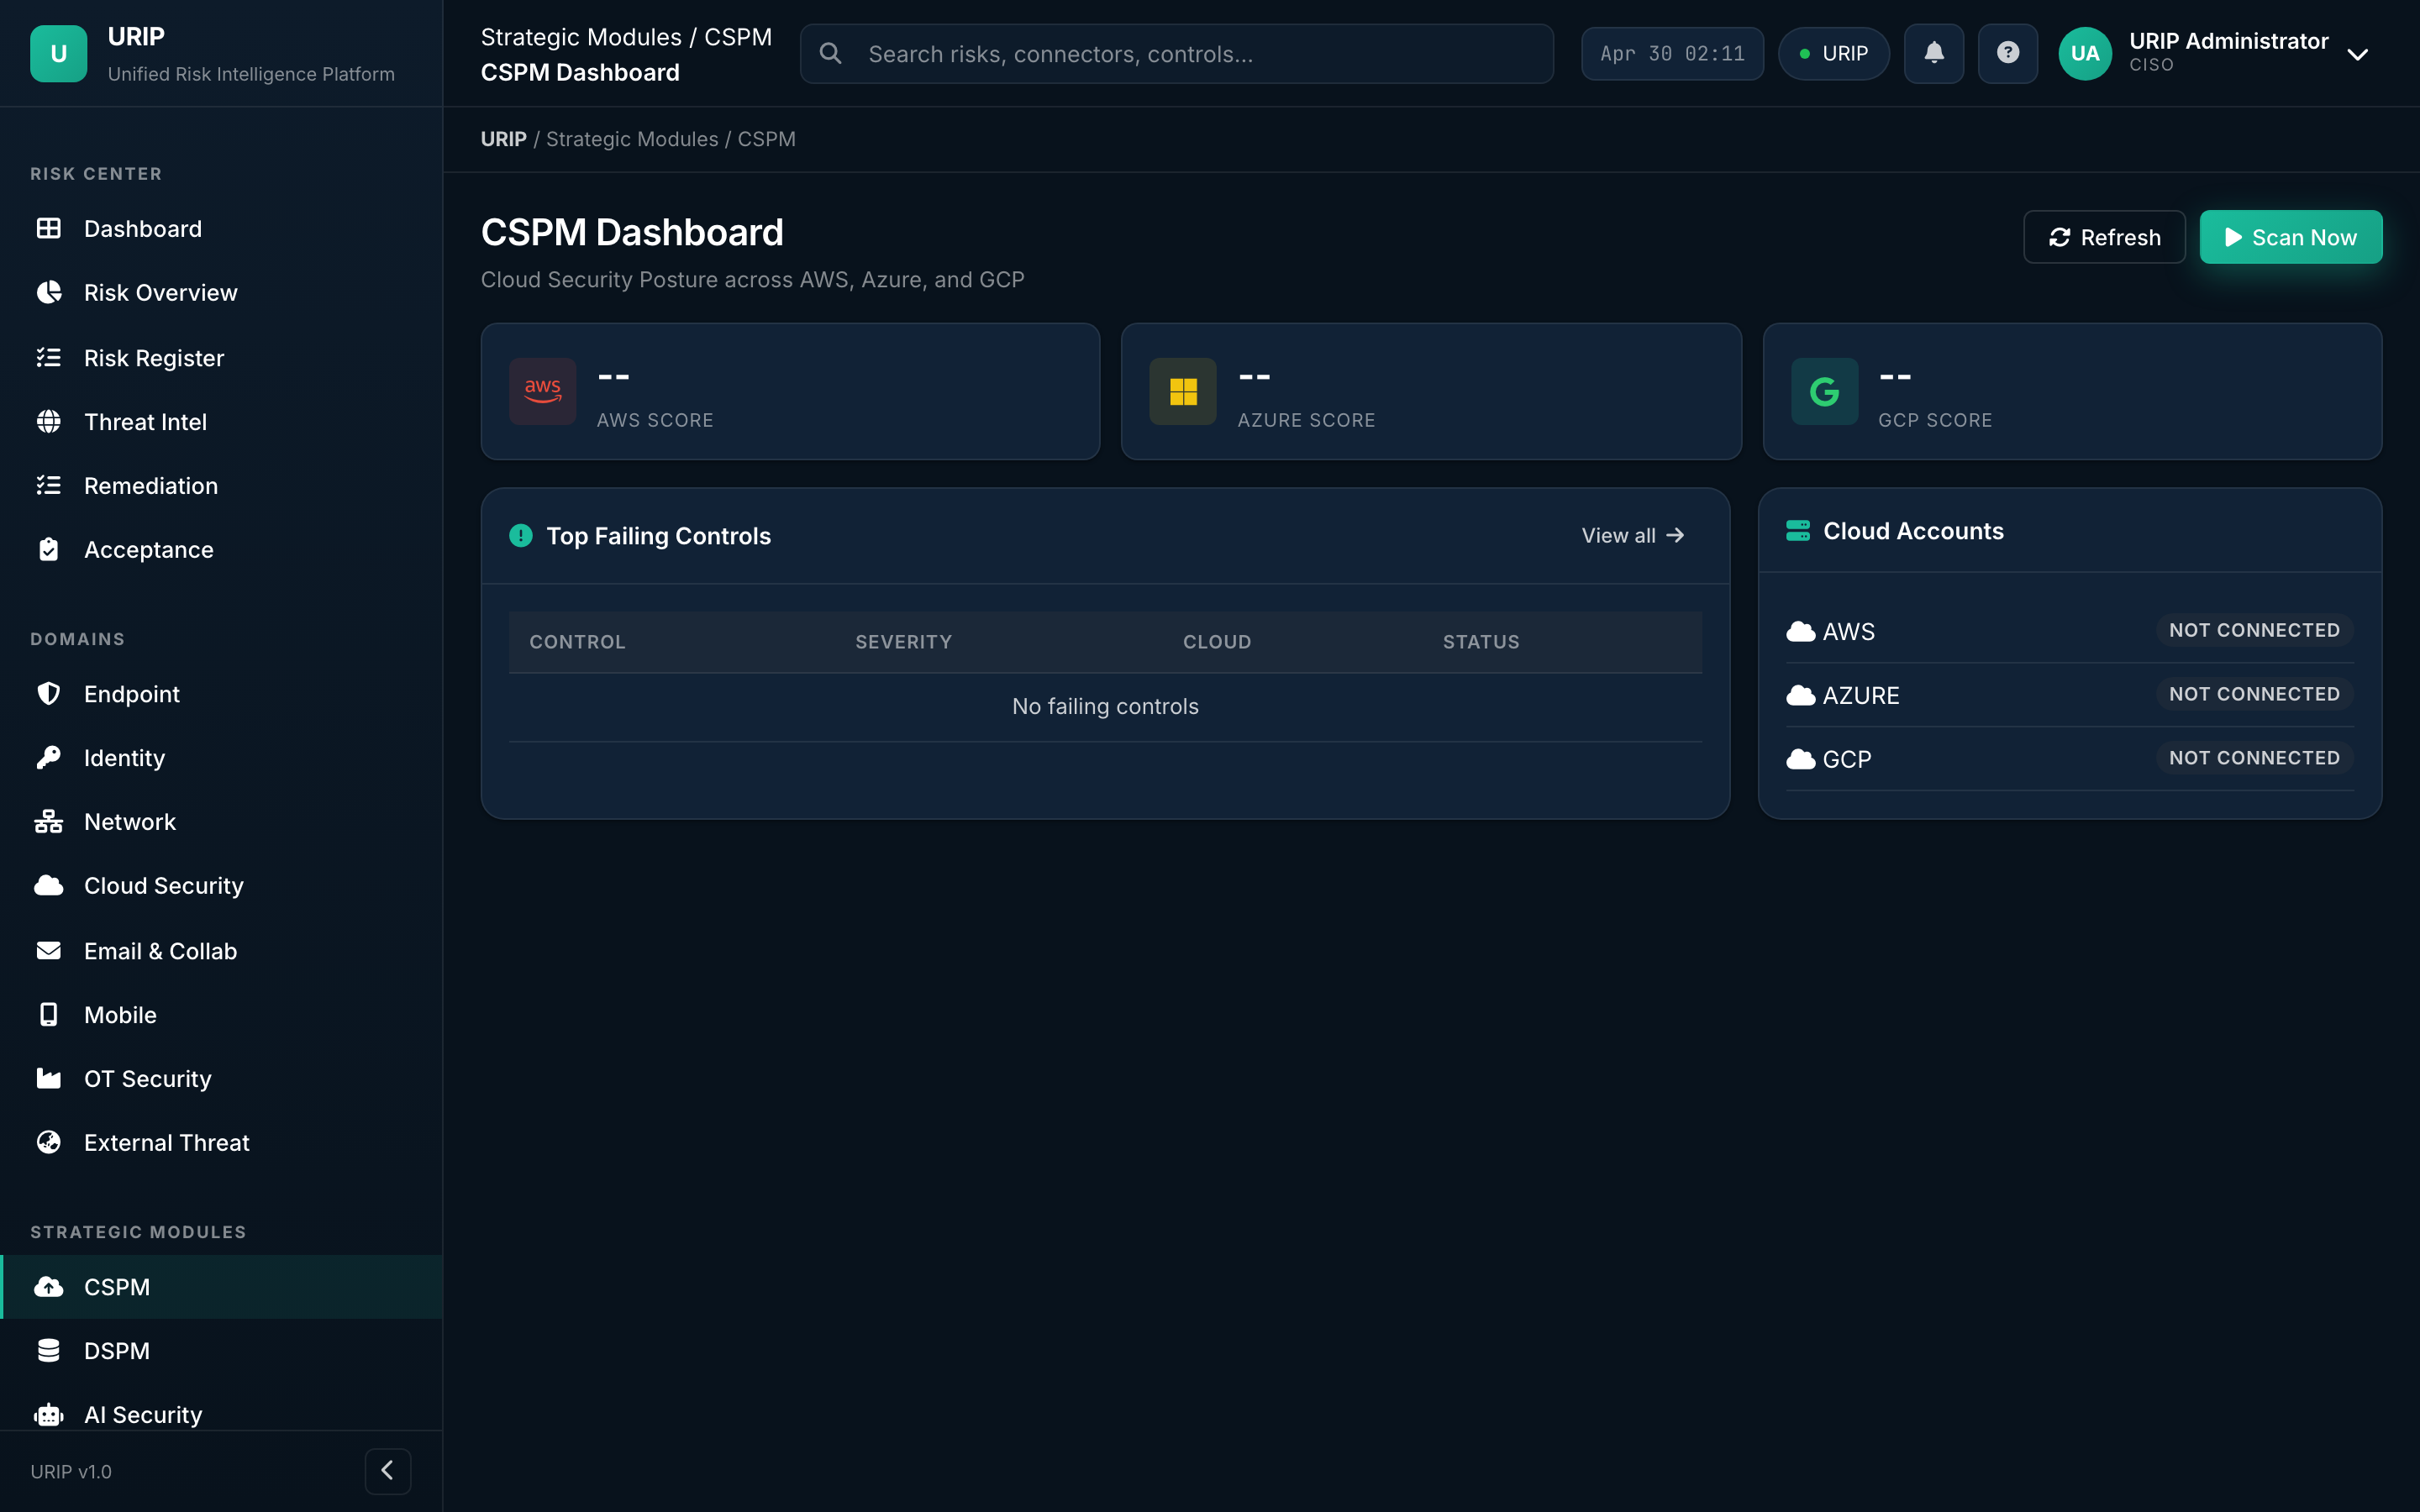
What it shows. Cloud Security Posture Management — misconfigurations across AWS, Azure, GCP, Oracle Cloud. Counts by provider, by control framework (CIS, NIST, PCI), by severity.
CSPM findings
URL: /cspm-findings.html
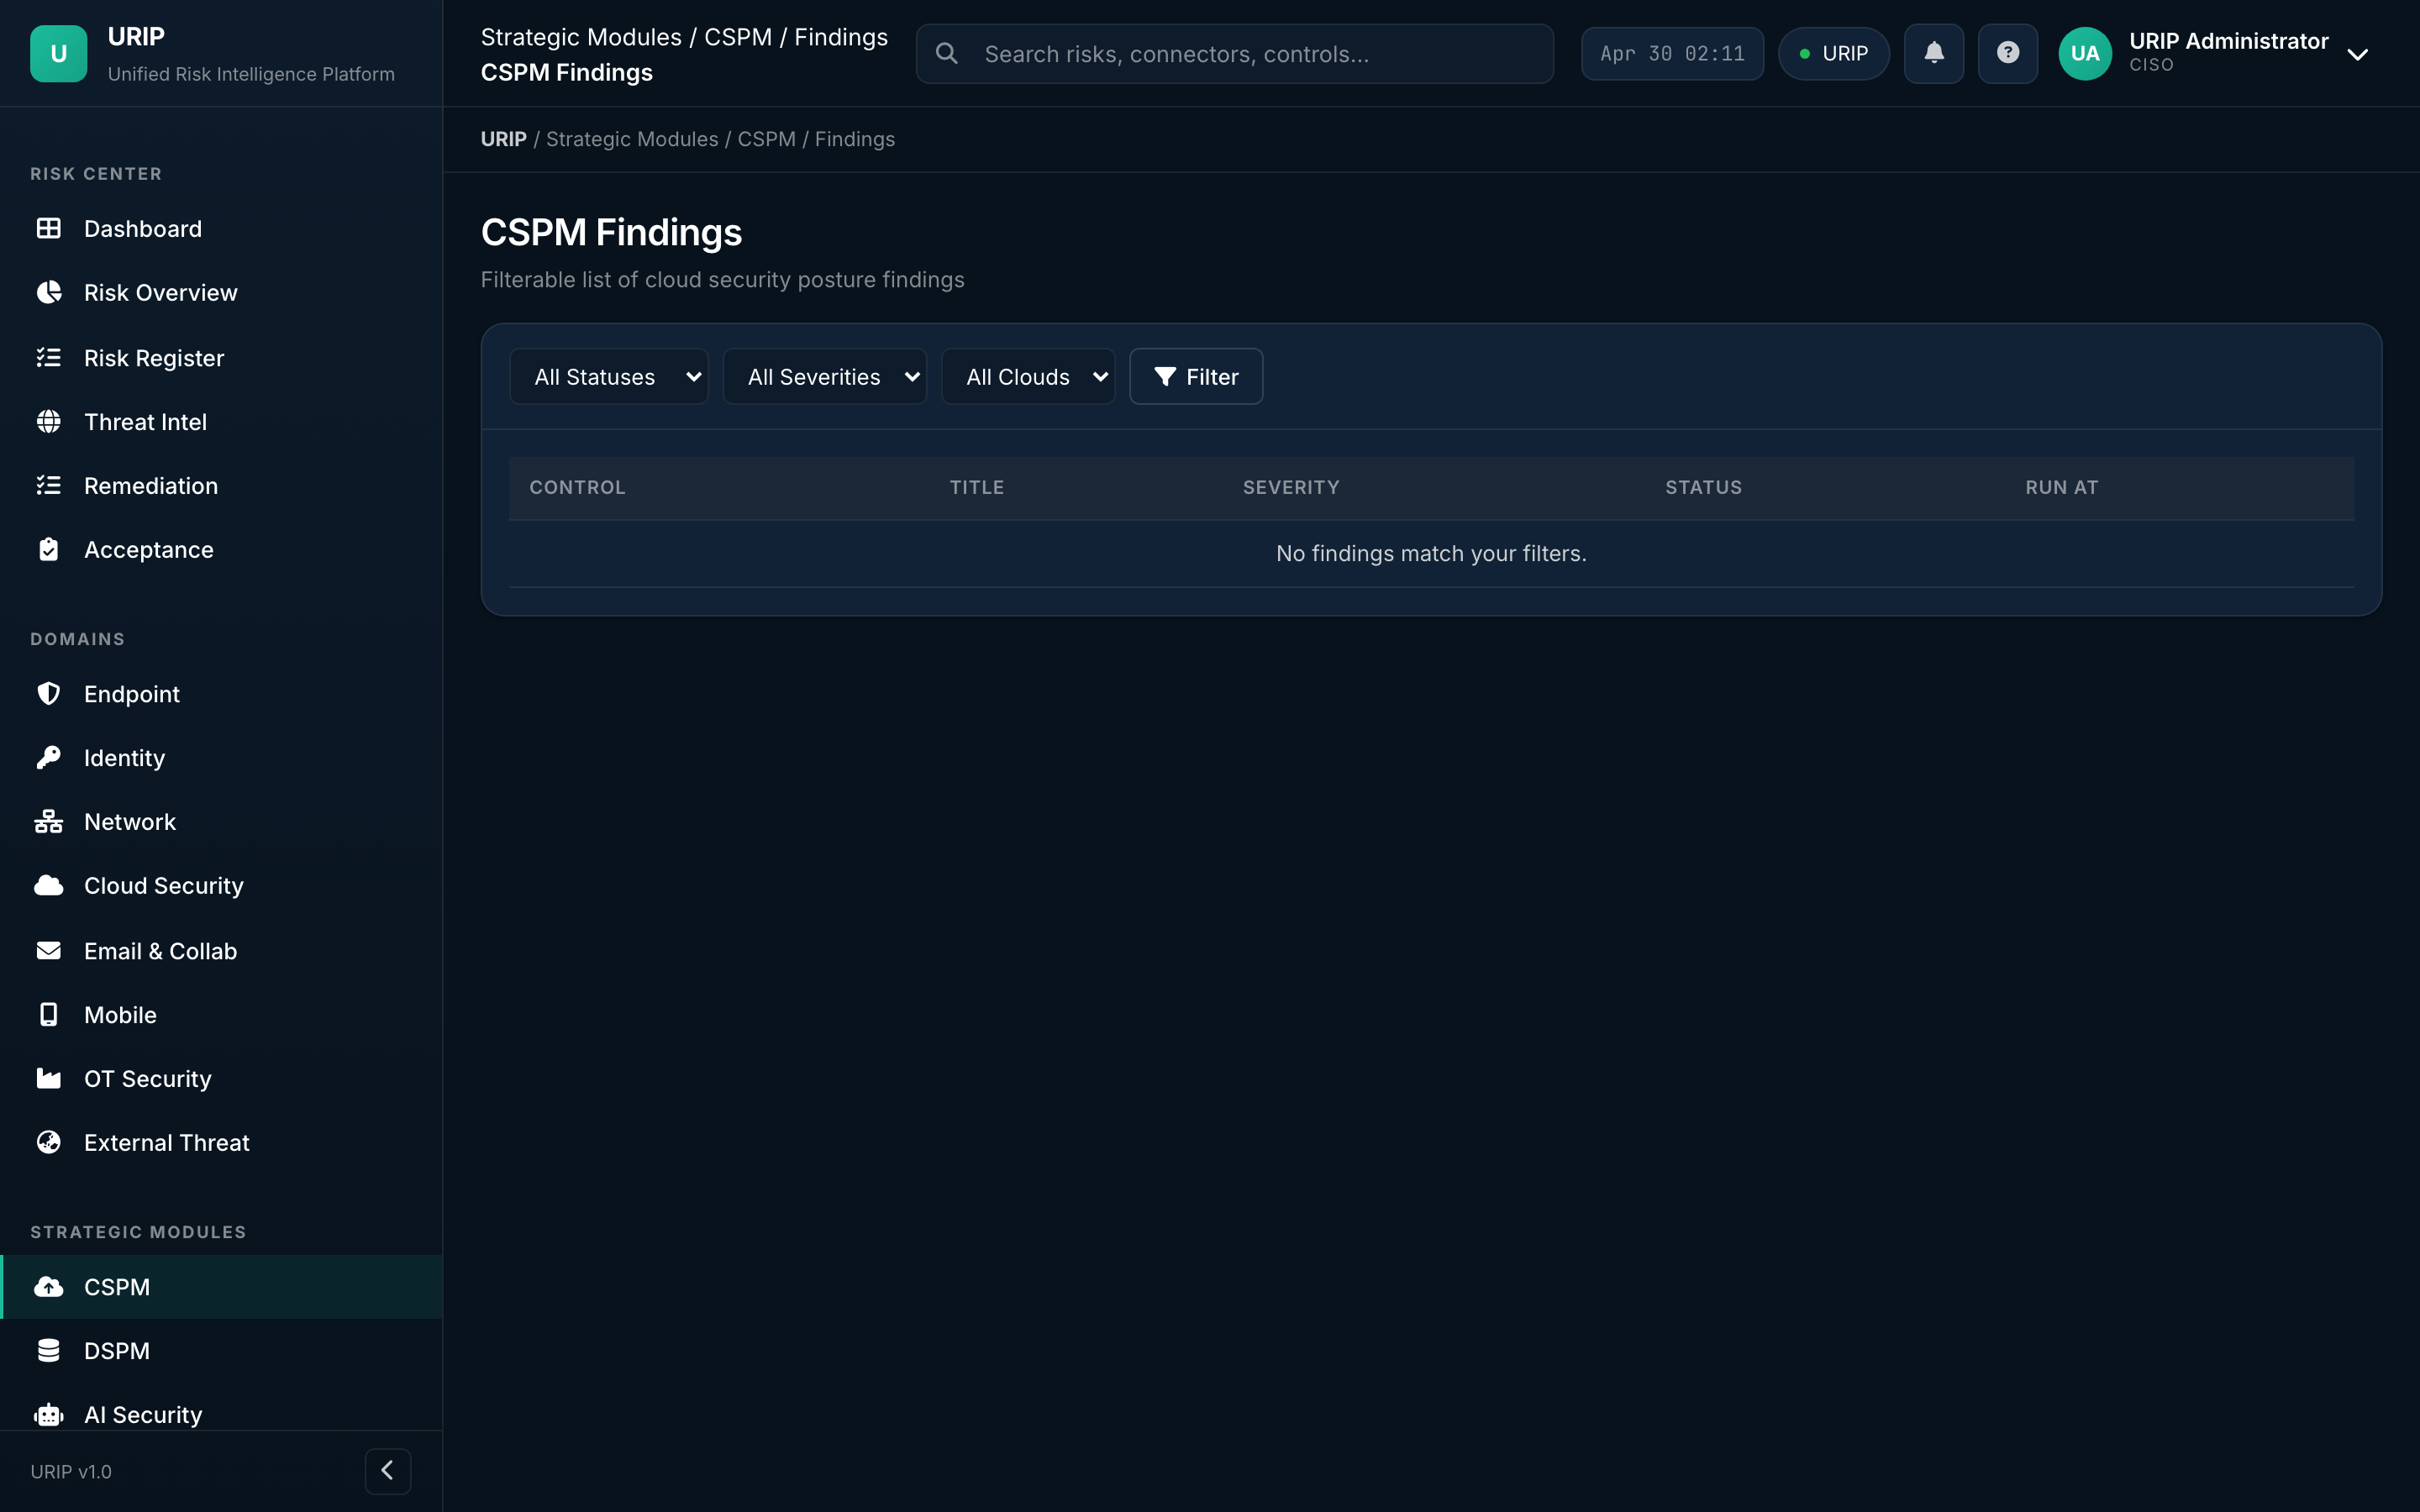
What it shows. Detailed table of every misconfiguration, with the exact resource ARN / resource ID, the failed control, and the cloud-native fix path.
DSPM dashboard
URL: /dspm-dashboard.html
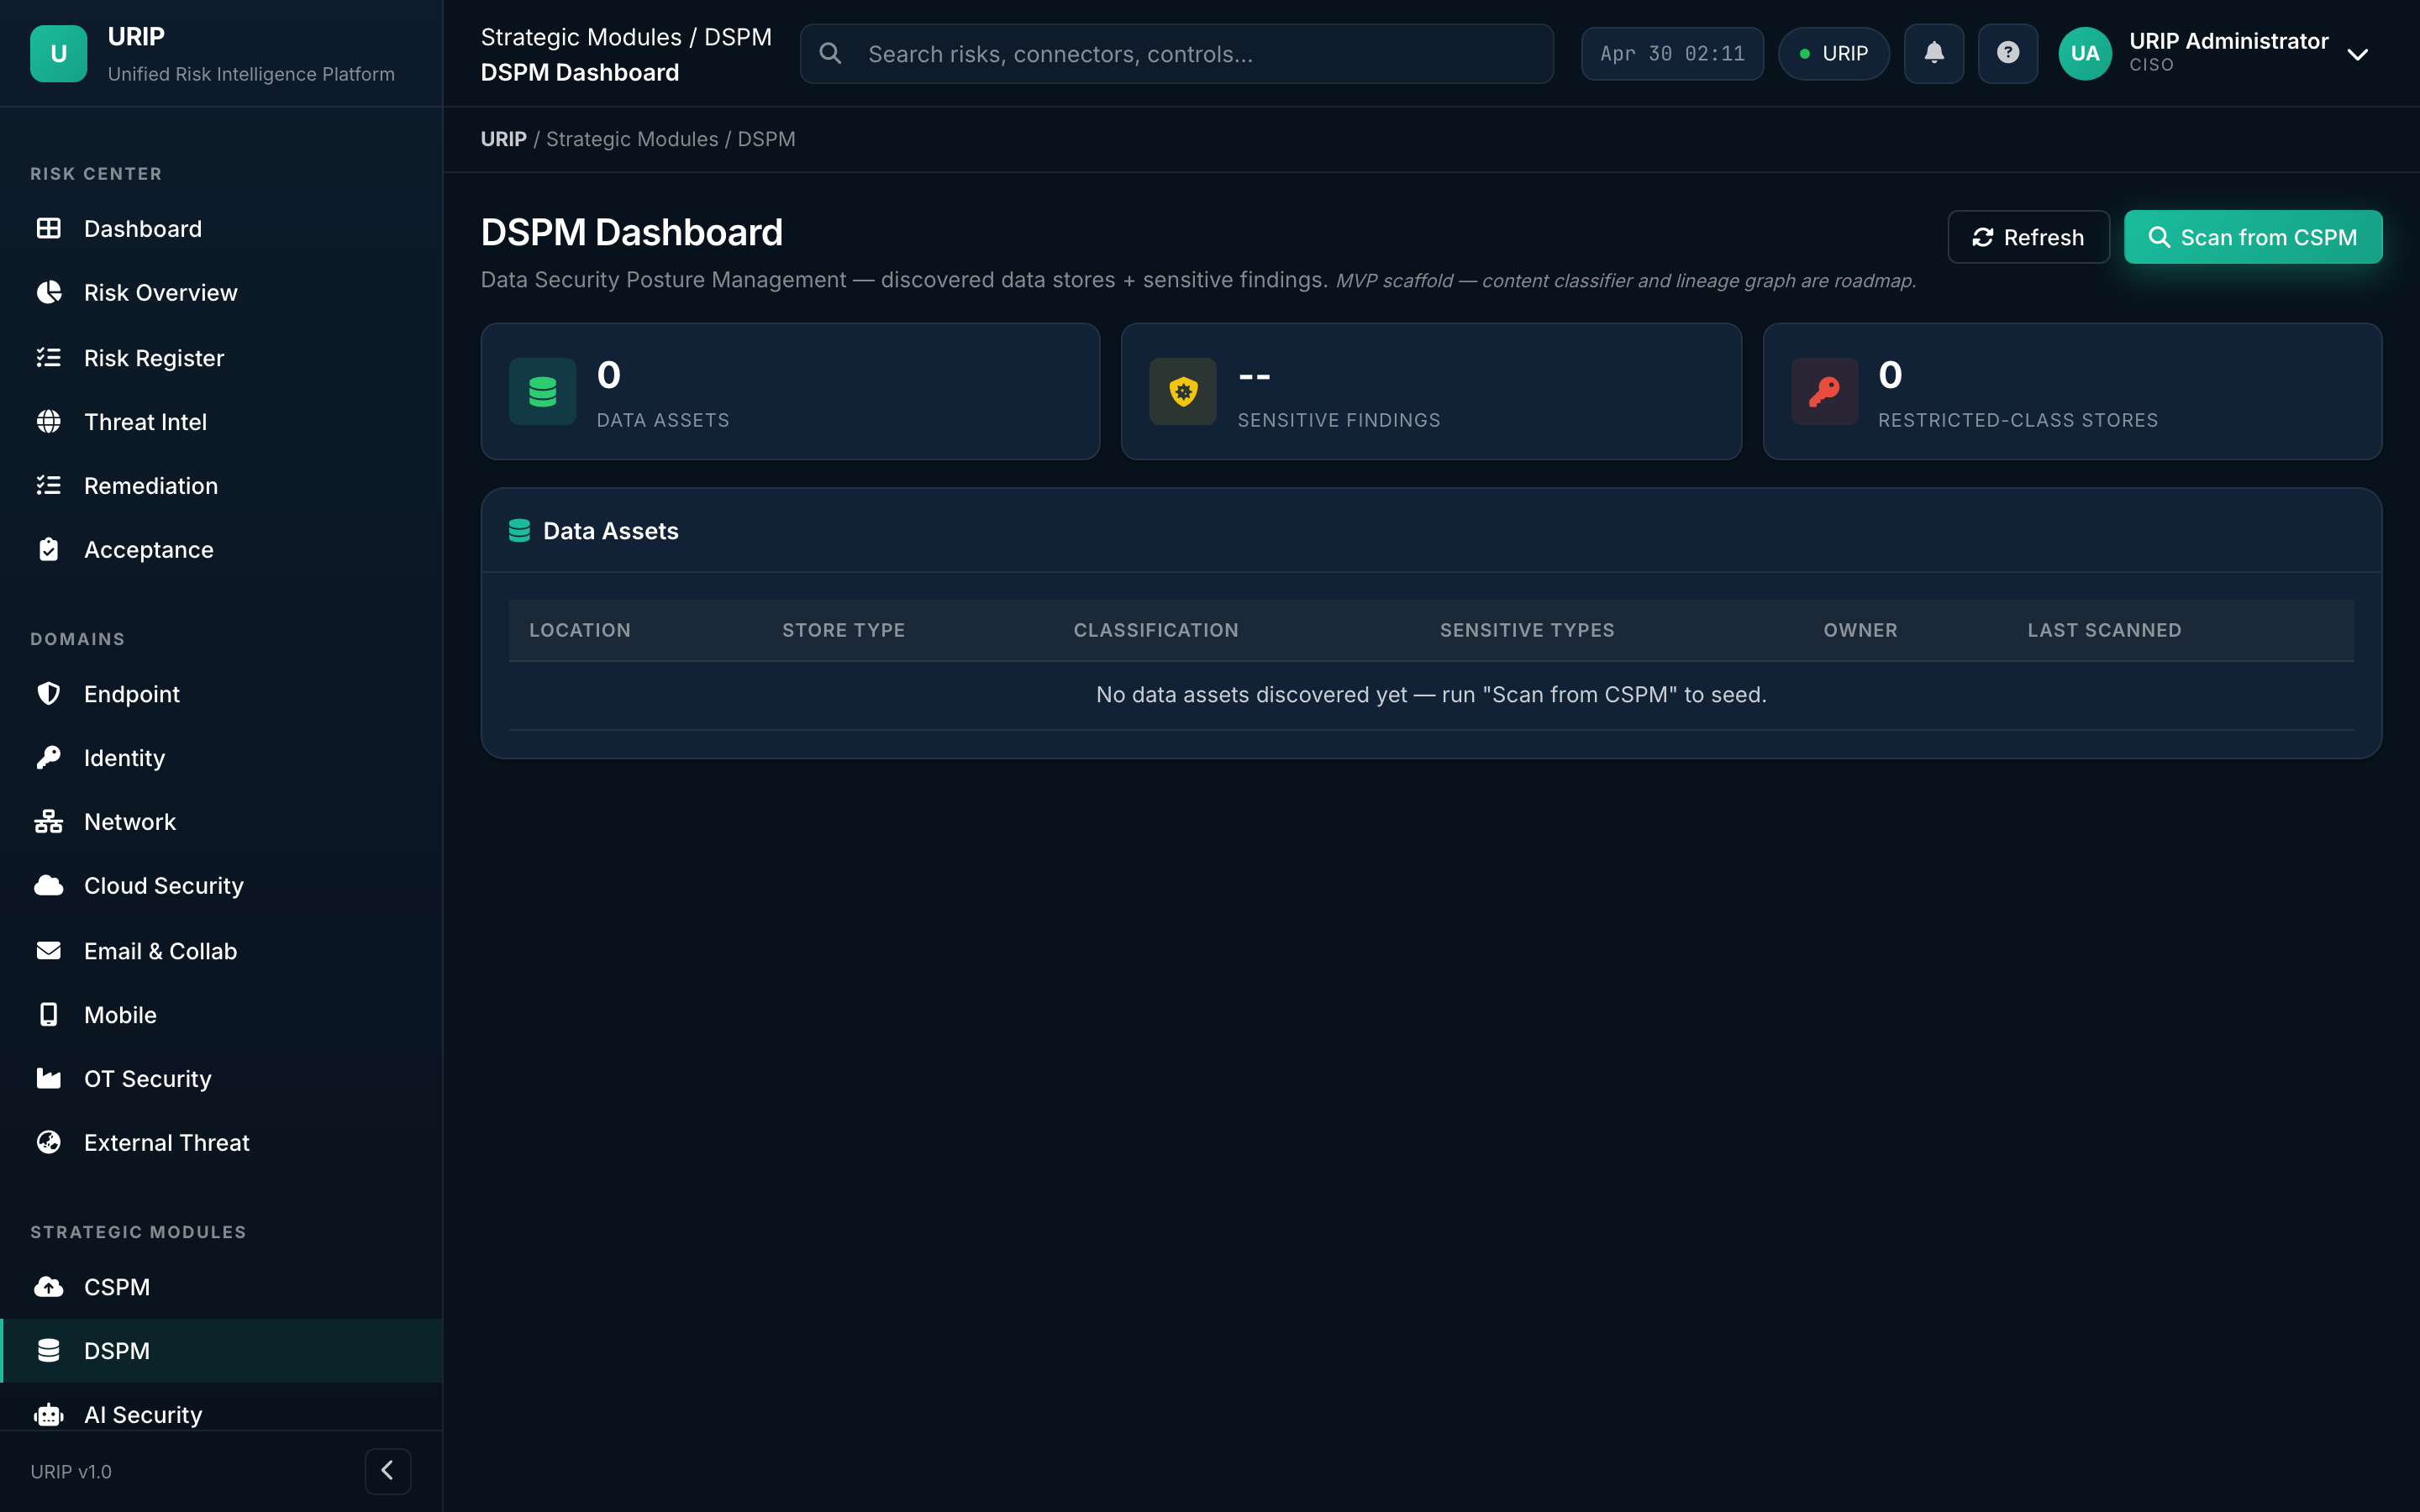
What it shows. Data Security Posture — sensitive data inventory by classification (PII, PHI, PCI), by location (S3, GCS, Snowflake, Postgres), and over-permissioned data shares.
AI Security dashboard
URL: /ai-security-dashboard.html
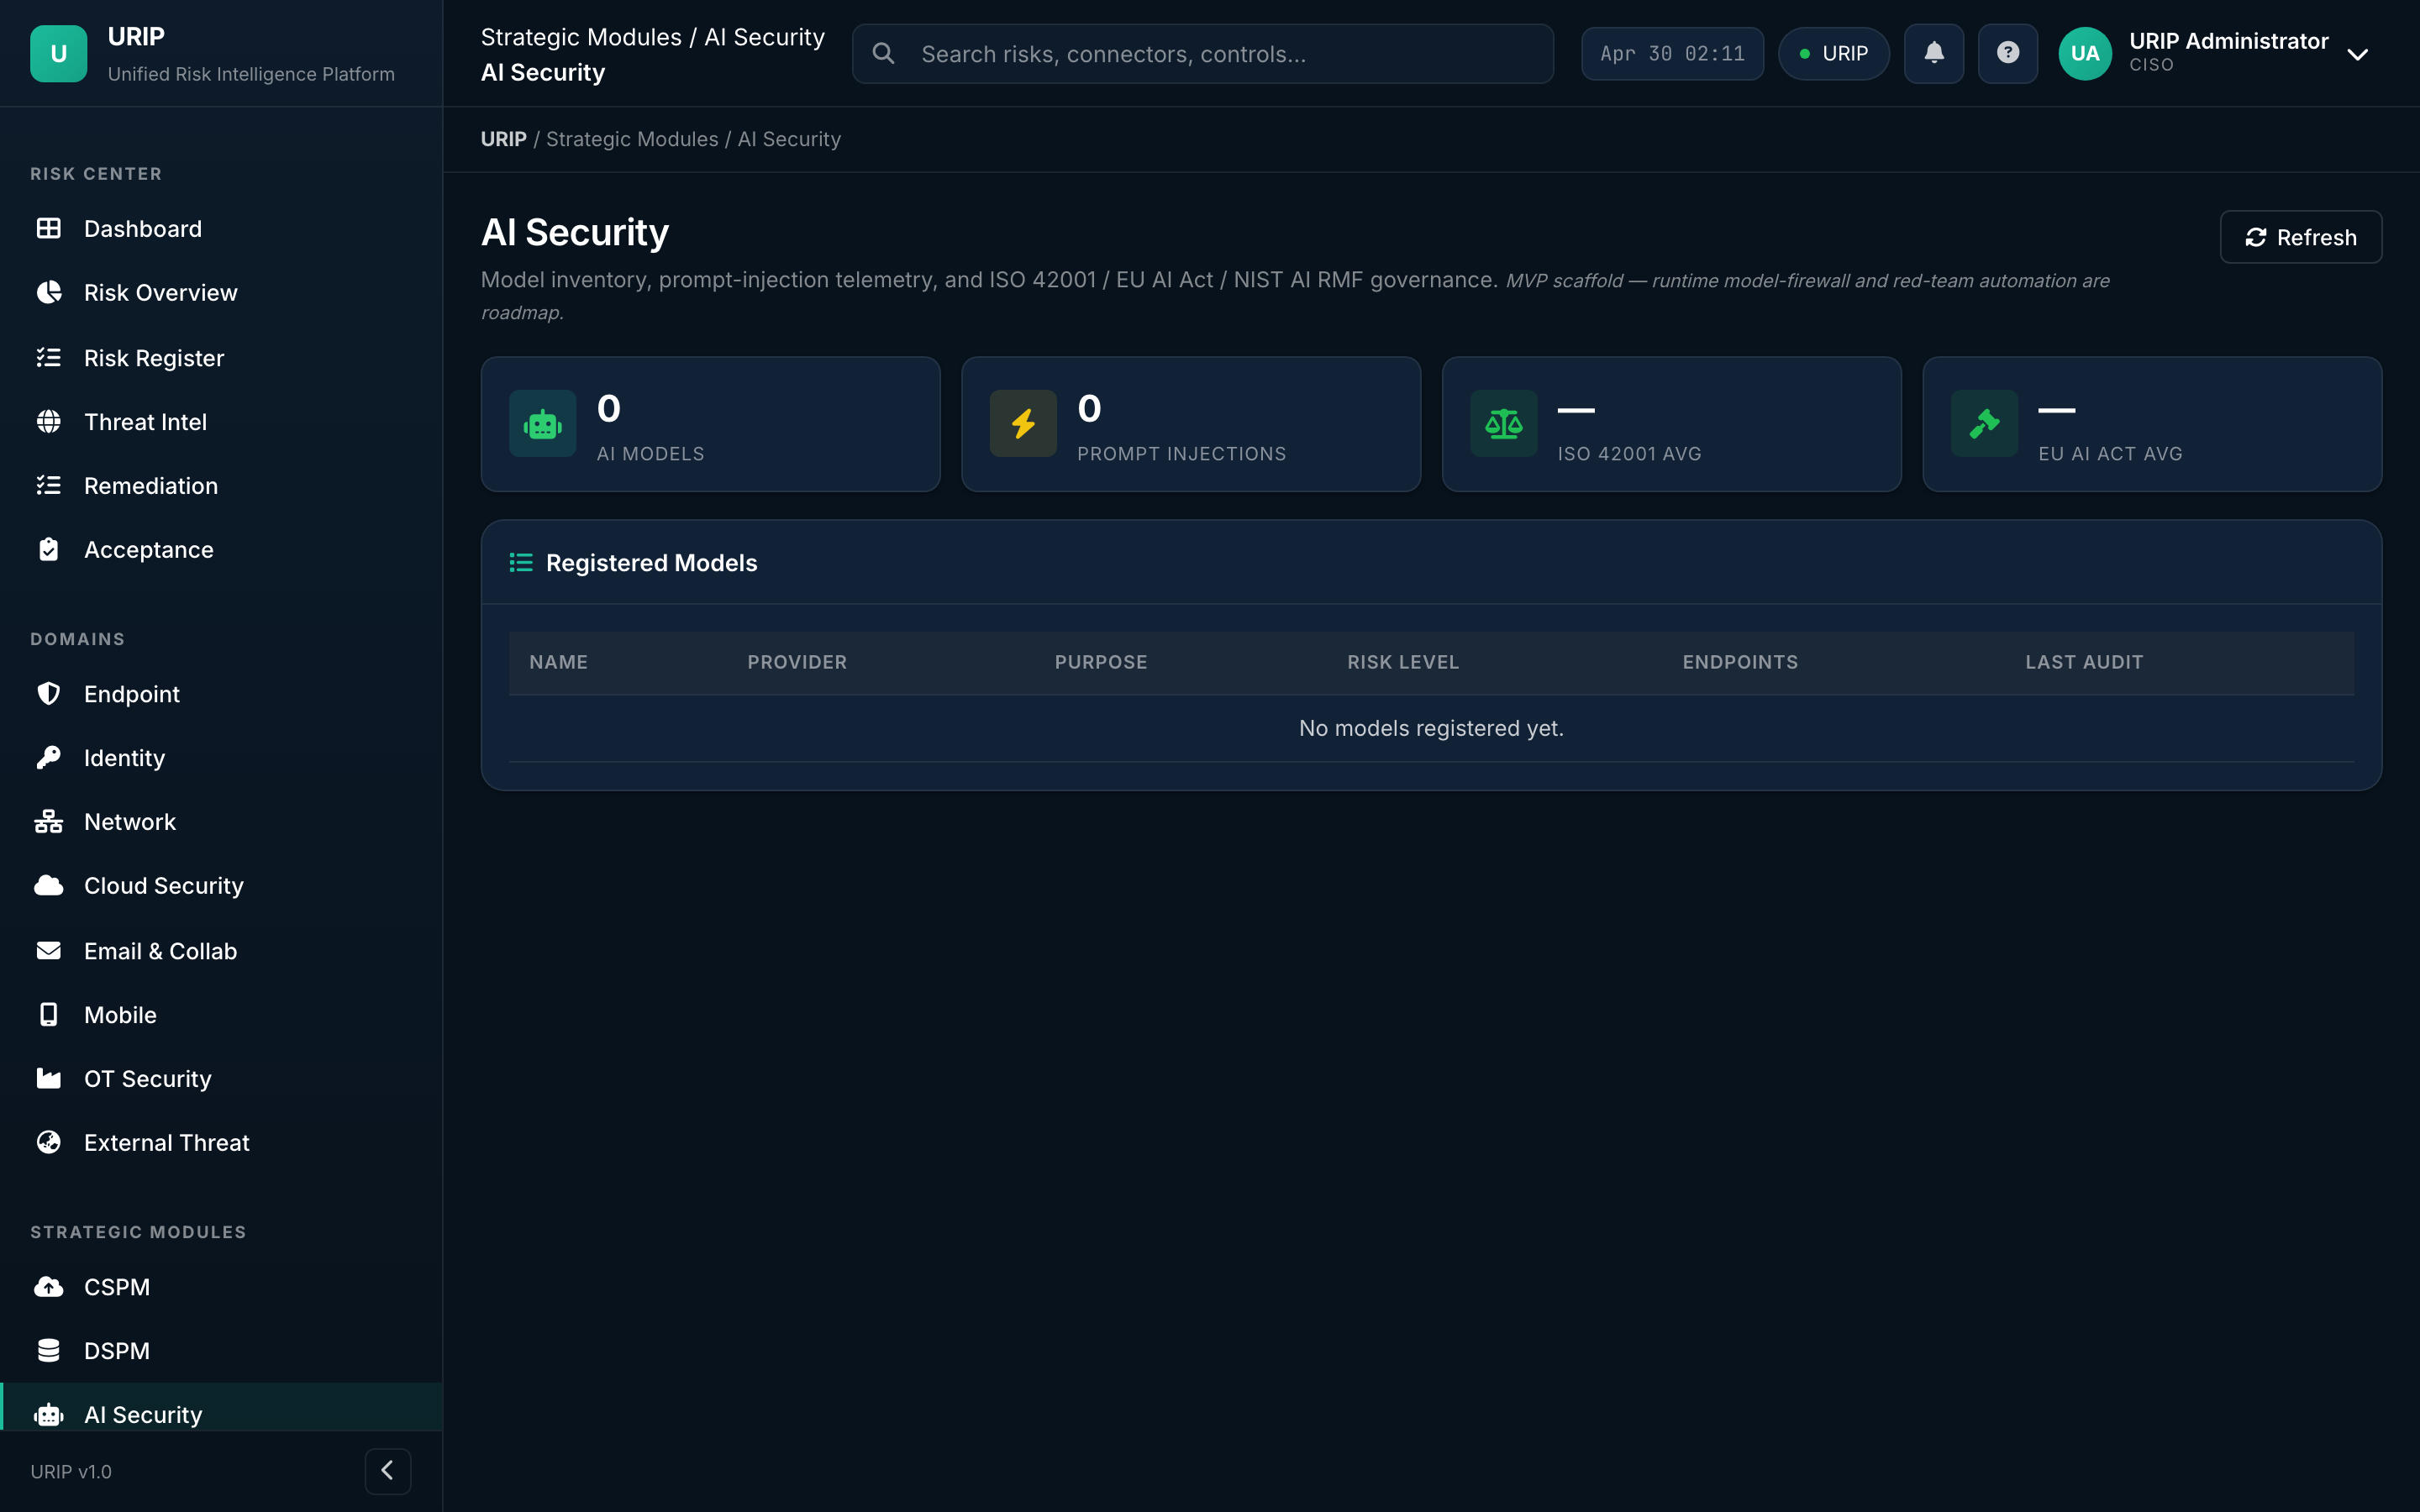
What it shows. Visibility into LLM and ML risk — shadow-AI usage discovered via egress logs, sanctioned-AI inventory, prompt-injection attempts, model-supply-chain warnings.
ZTNA dashboard
URL: /ztna-dashboard.html
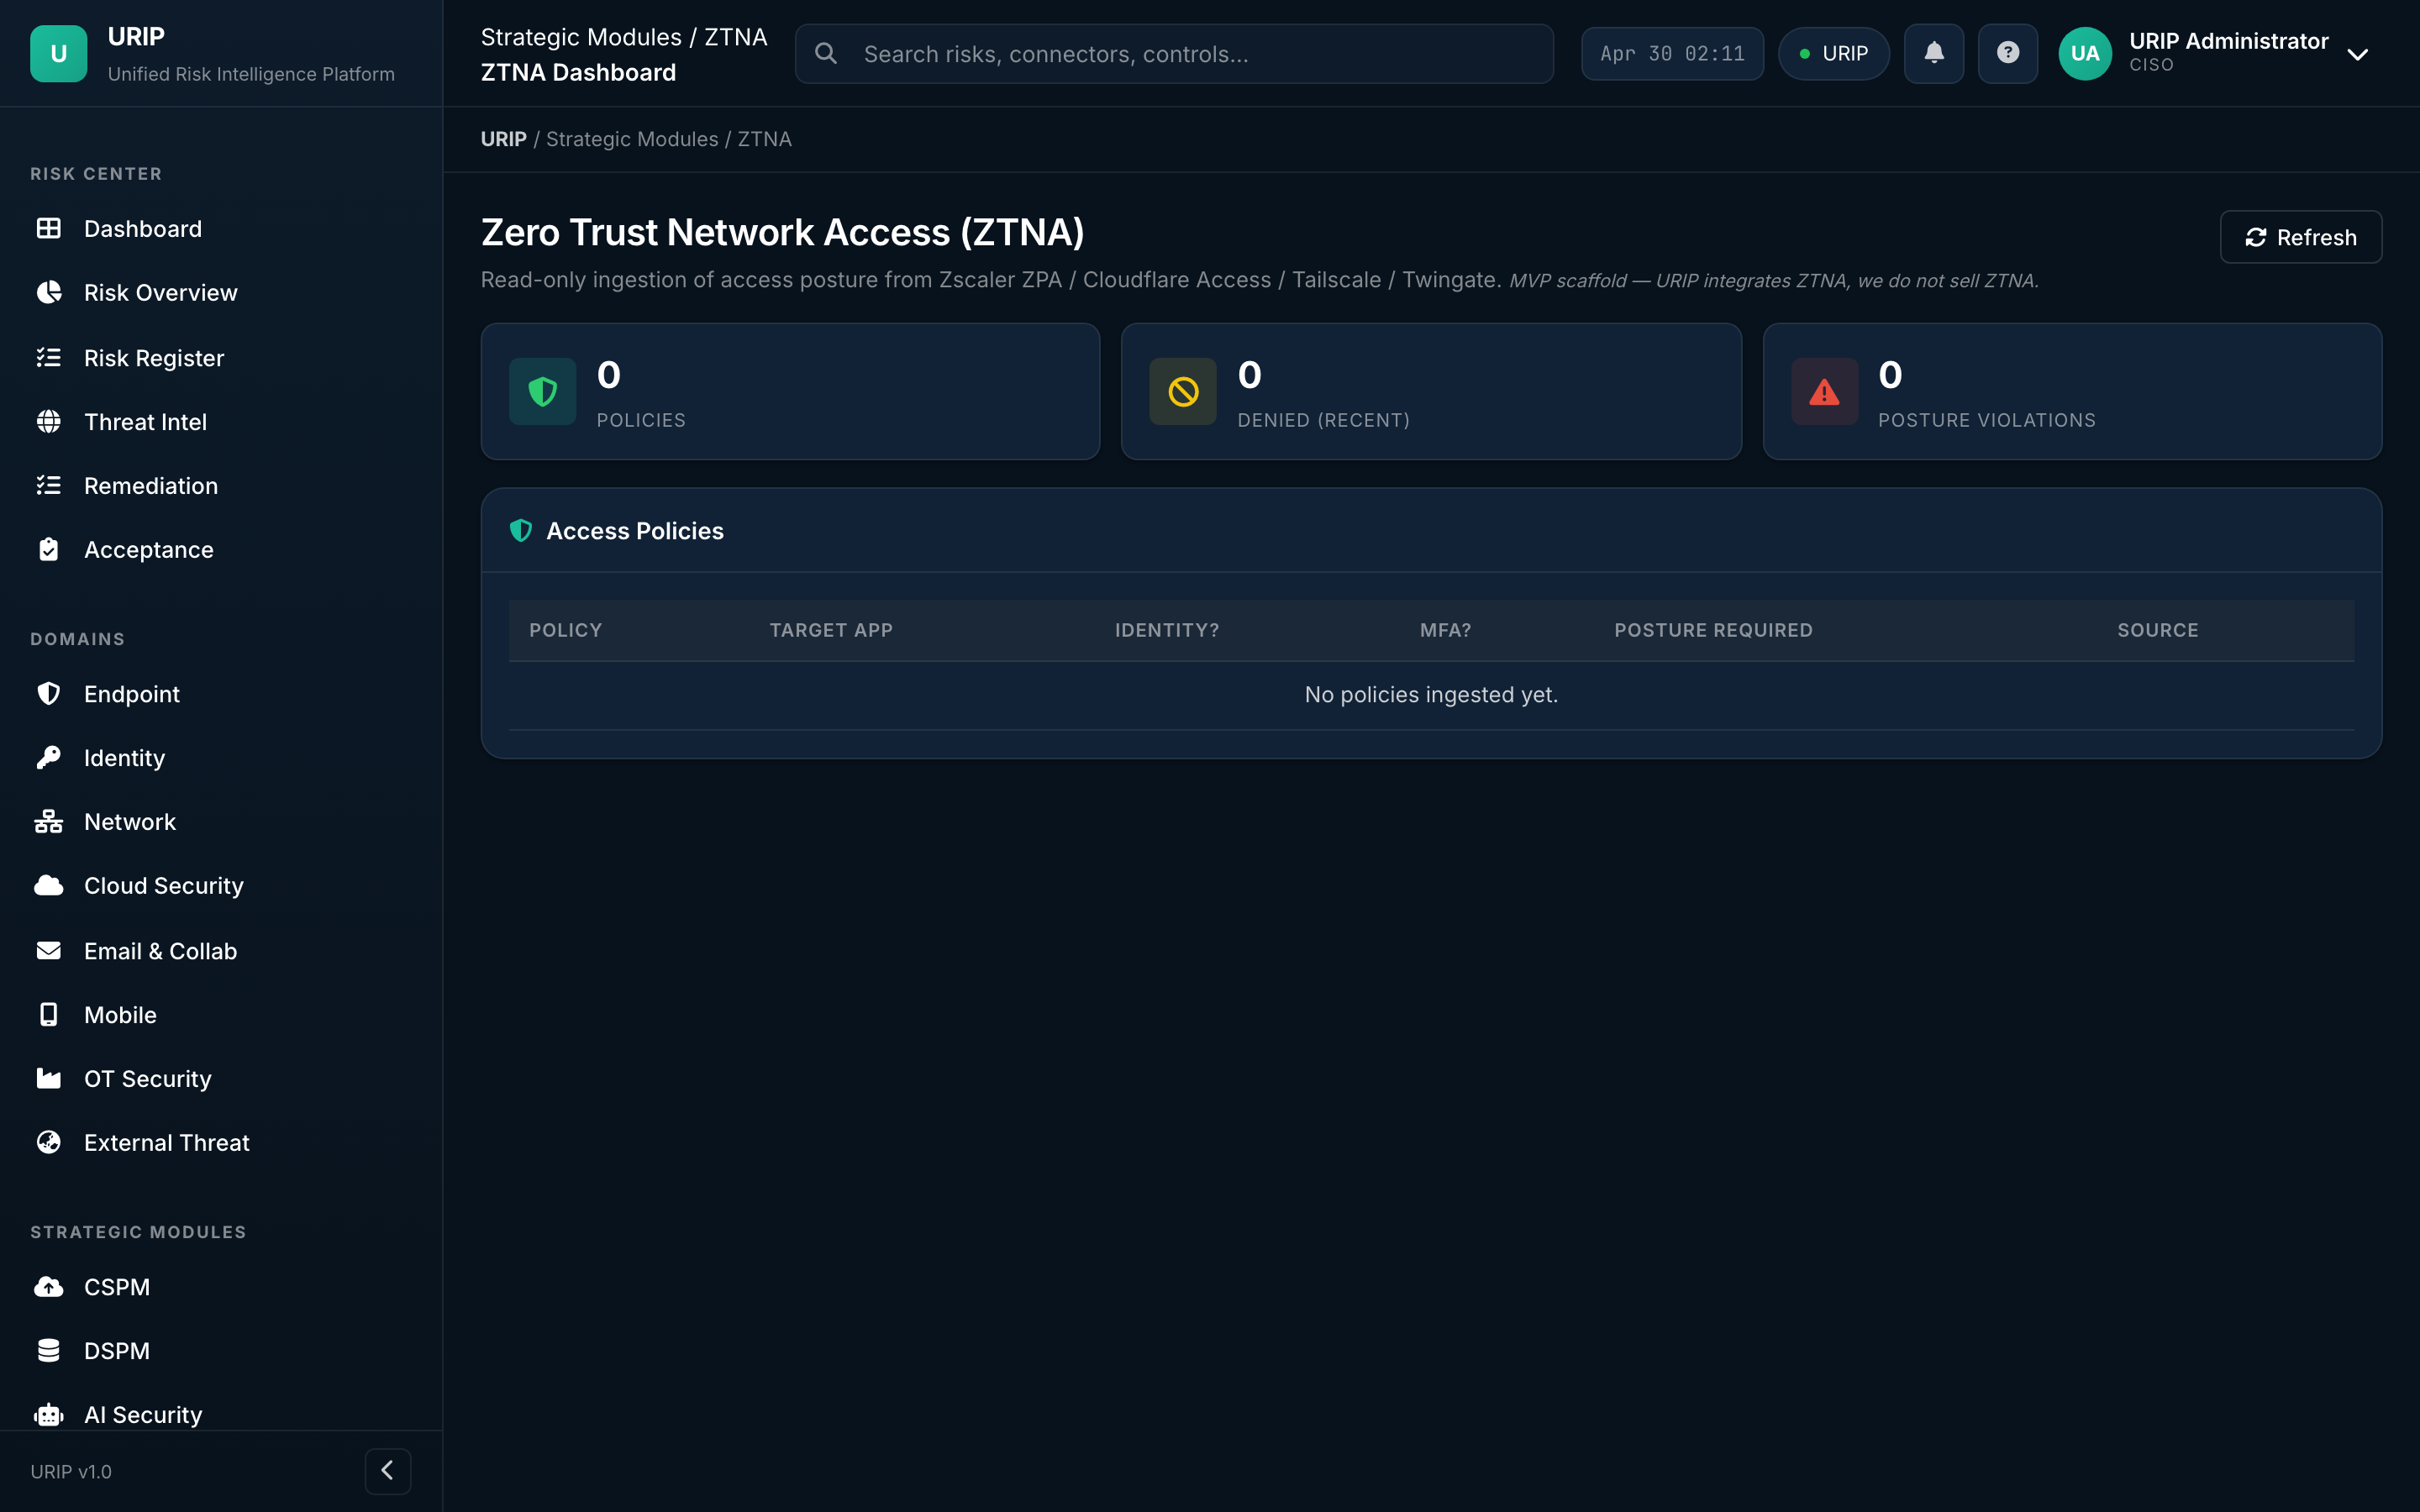
What it shows. Zero Trust Network Access — sessions, policy decisions, denied attempts, device-posture gates. Pulls from Zscaler, Netskope, Cloudflare ZT, Palo Alto Prisma Access.
5. Domain rollups
URIP groups risk by eight domains (Endpoint, Identity, Network, Cloud, Email, Mobile, OT, External Threat) plus Compliance Summary and Workflow. Every domain rollup follows the same pattern: which connectors feed it, the rolled-up risk score, and the open / closed split. Two representatives below — the rest follow the same template.
Endpoint domain (representative)
URL: /domain-endpoint.html
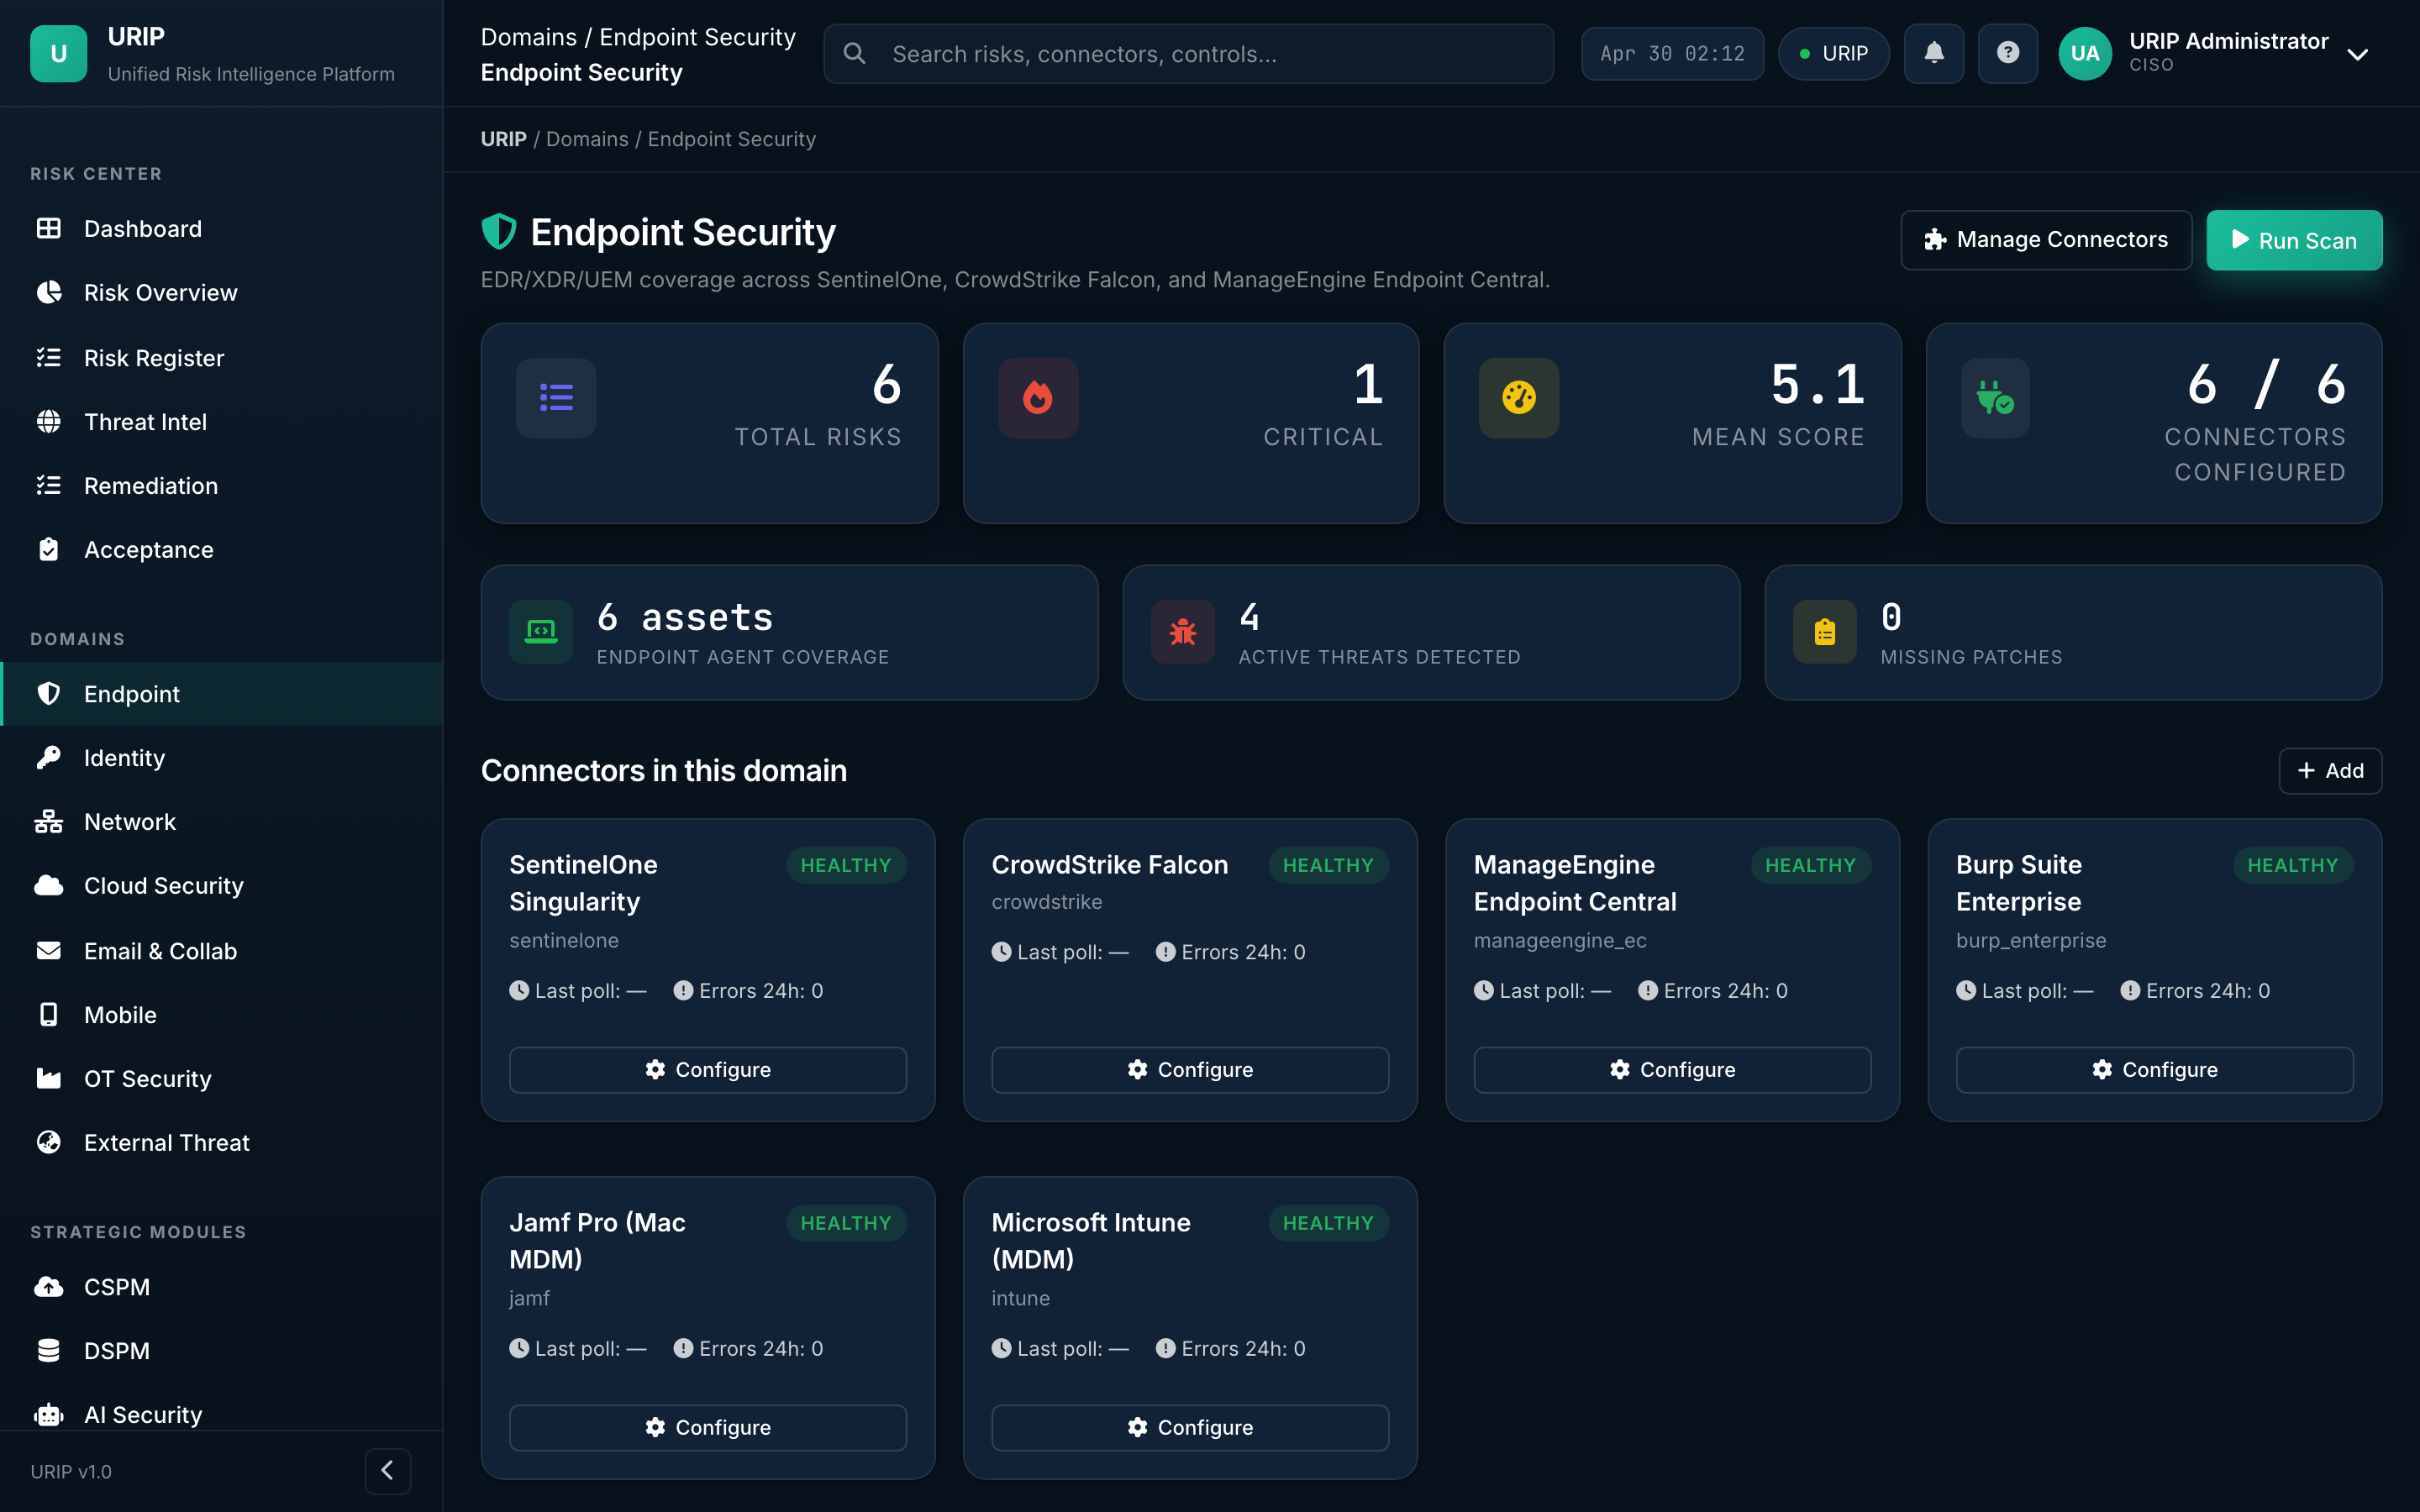
What it shows. Every endpoint signal in one place — EDR alerts (CrowdStrike, SentinelOne, Defender, Sophos), patch posture, MDM compliance, encryption coverage.
What you do here. Pick the row that's bleeding the most → drill into the asset → close.
Cloud domain (representative)
URL: /domain-cloud.html
What it shows. All cloud signal — IAM drift, public-bucket exposure, misconfigured services, runtime threats. Aggregates from CSPM + your IaaS connectors.
The other eight rollups (Identity / Network / Email / Mobile / OT / External Threat / Compliance Summary / Workflow) follow this same layout.
6. Assets, connectors, admin
Asset inventory
URL: /asset-inventory.html
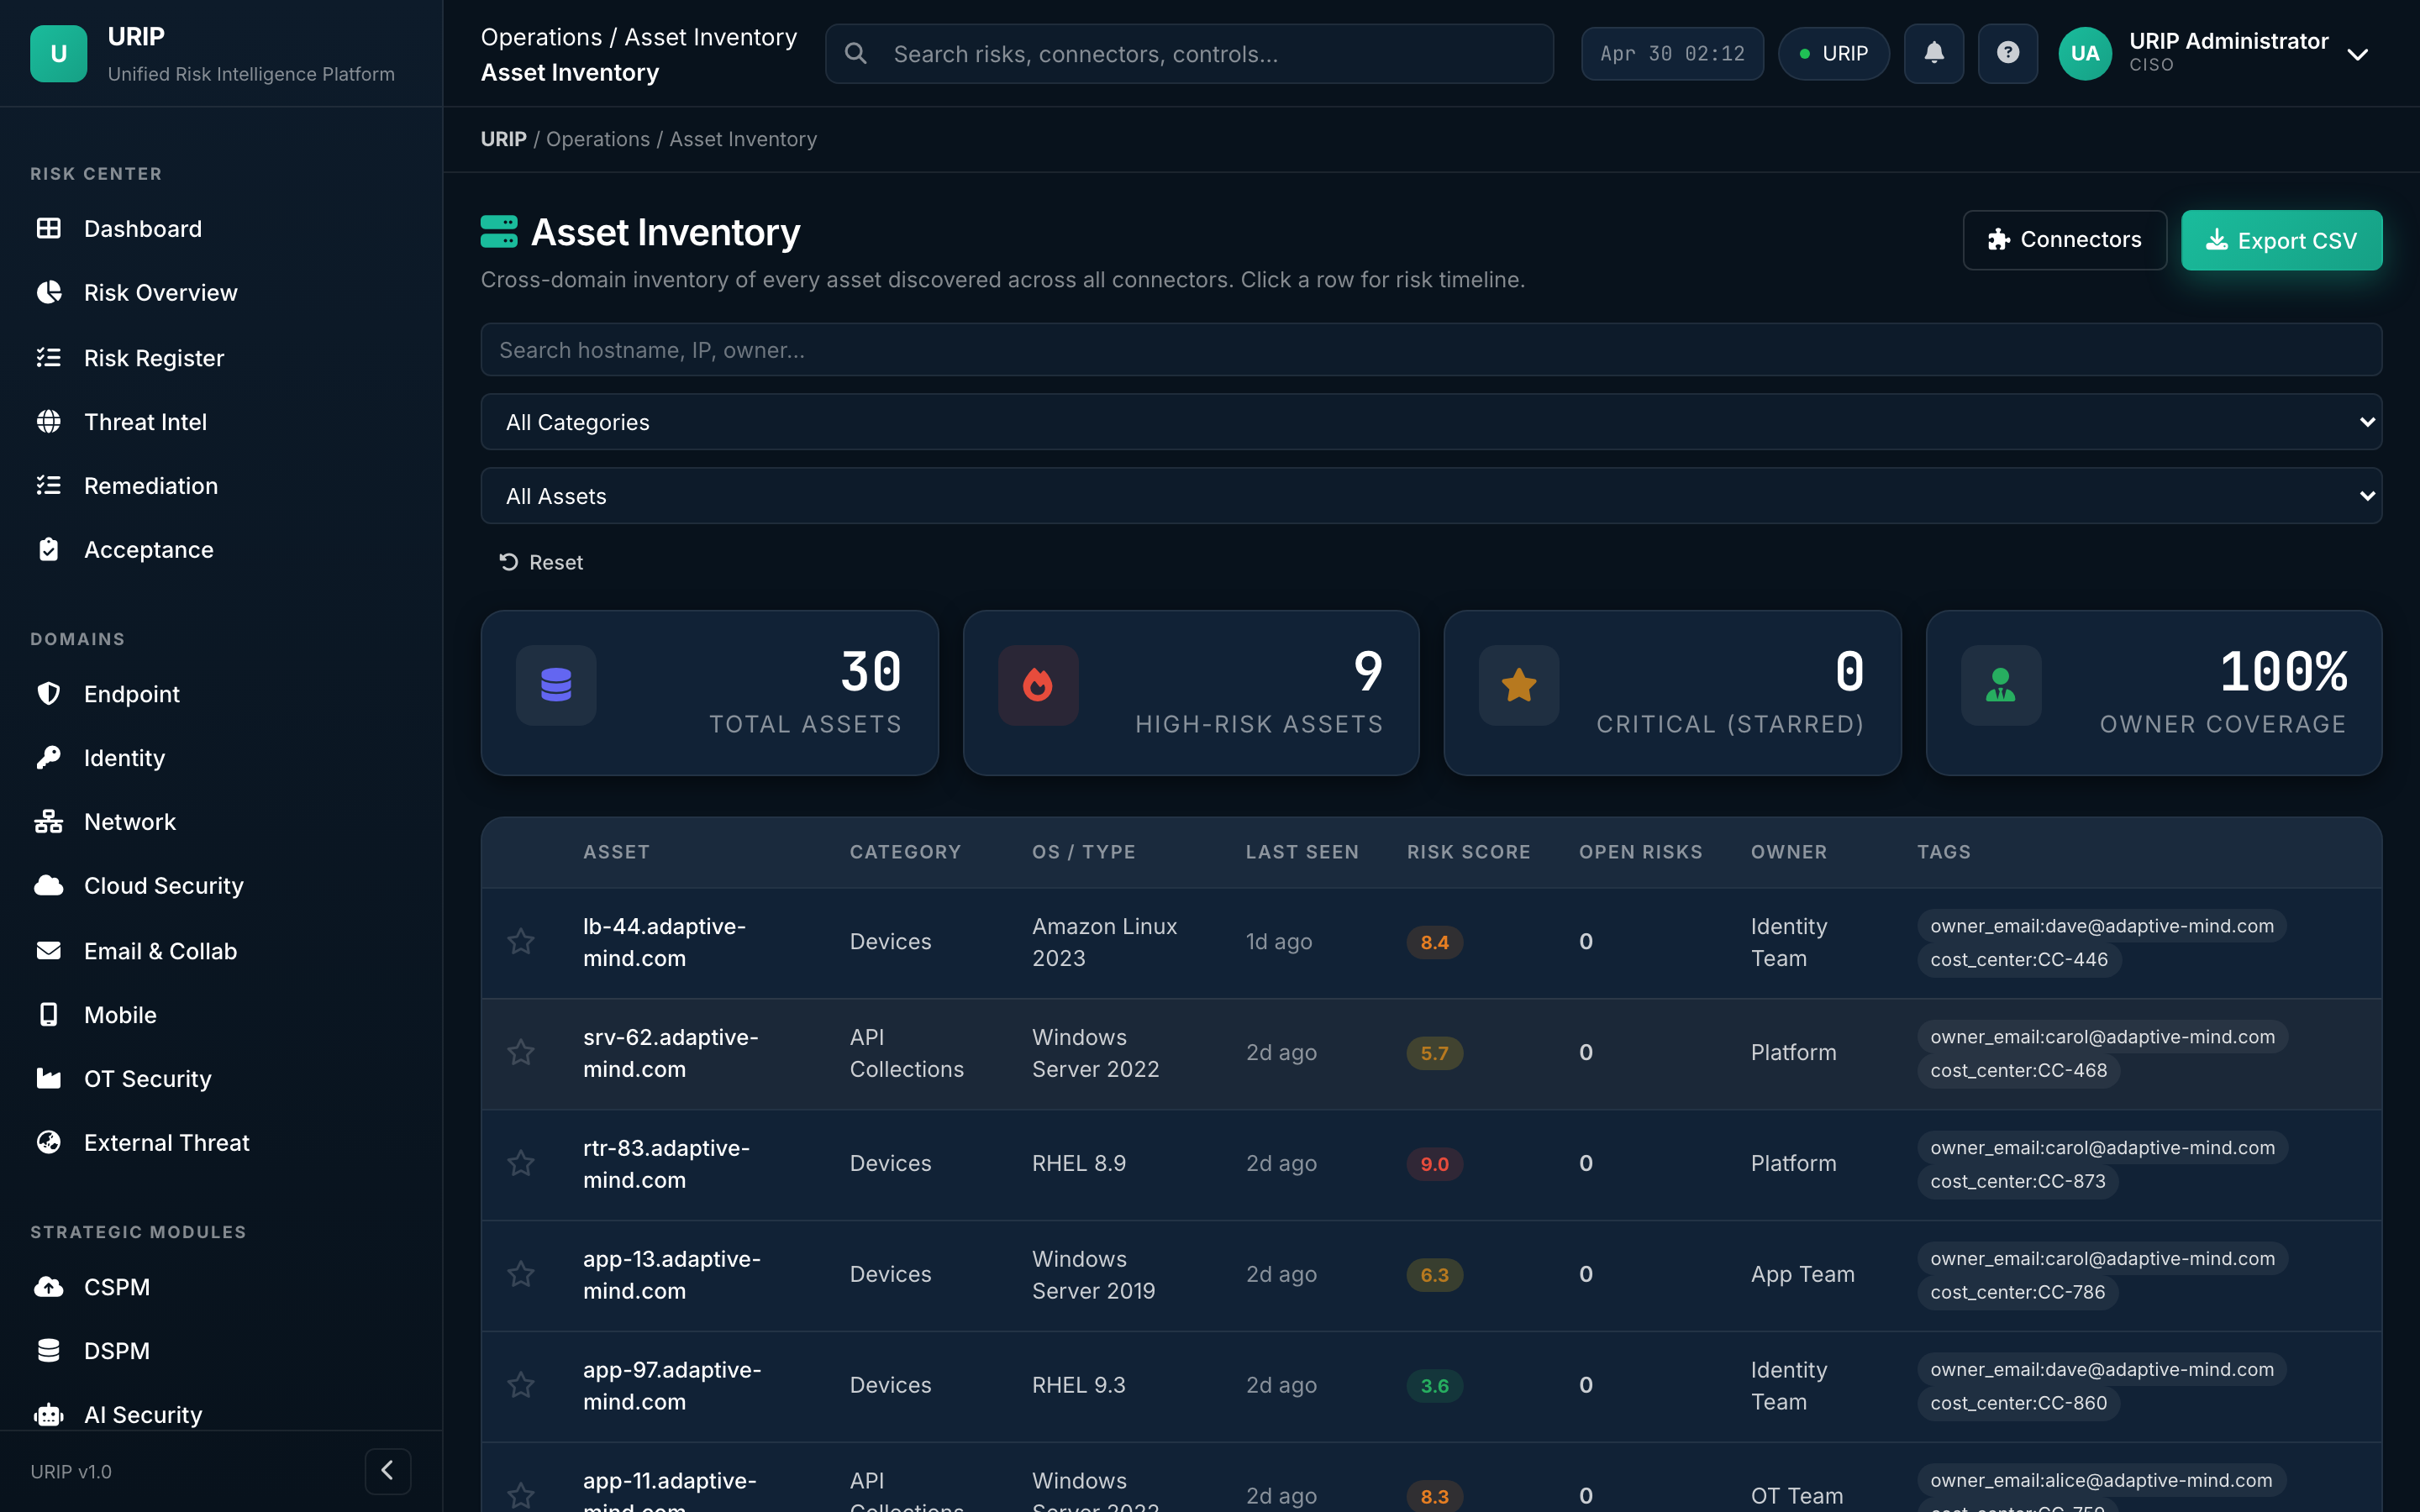
What it shows. Single source of truth for every asset URIP knows about — endpoints, identities, cloud resources, applications. Each row shows the asset's risk score, the connectors that report on it, and the open findings.
What you do here. Tag tier (T0 / T1 / T2), assign business owner, view all findings on one asset.
Tool catalog
URL: /tool-catalog.html
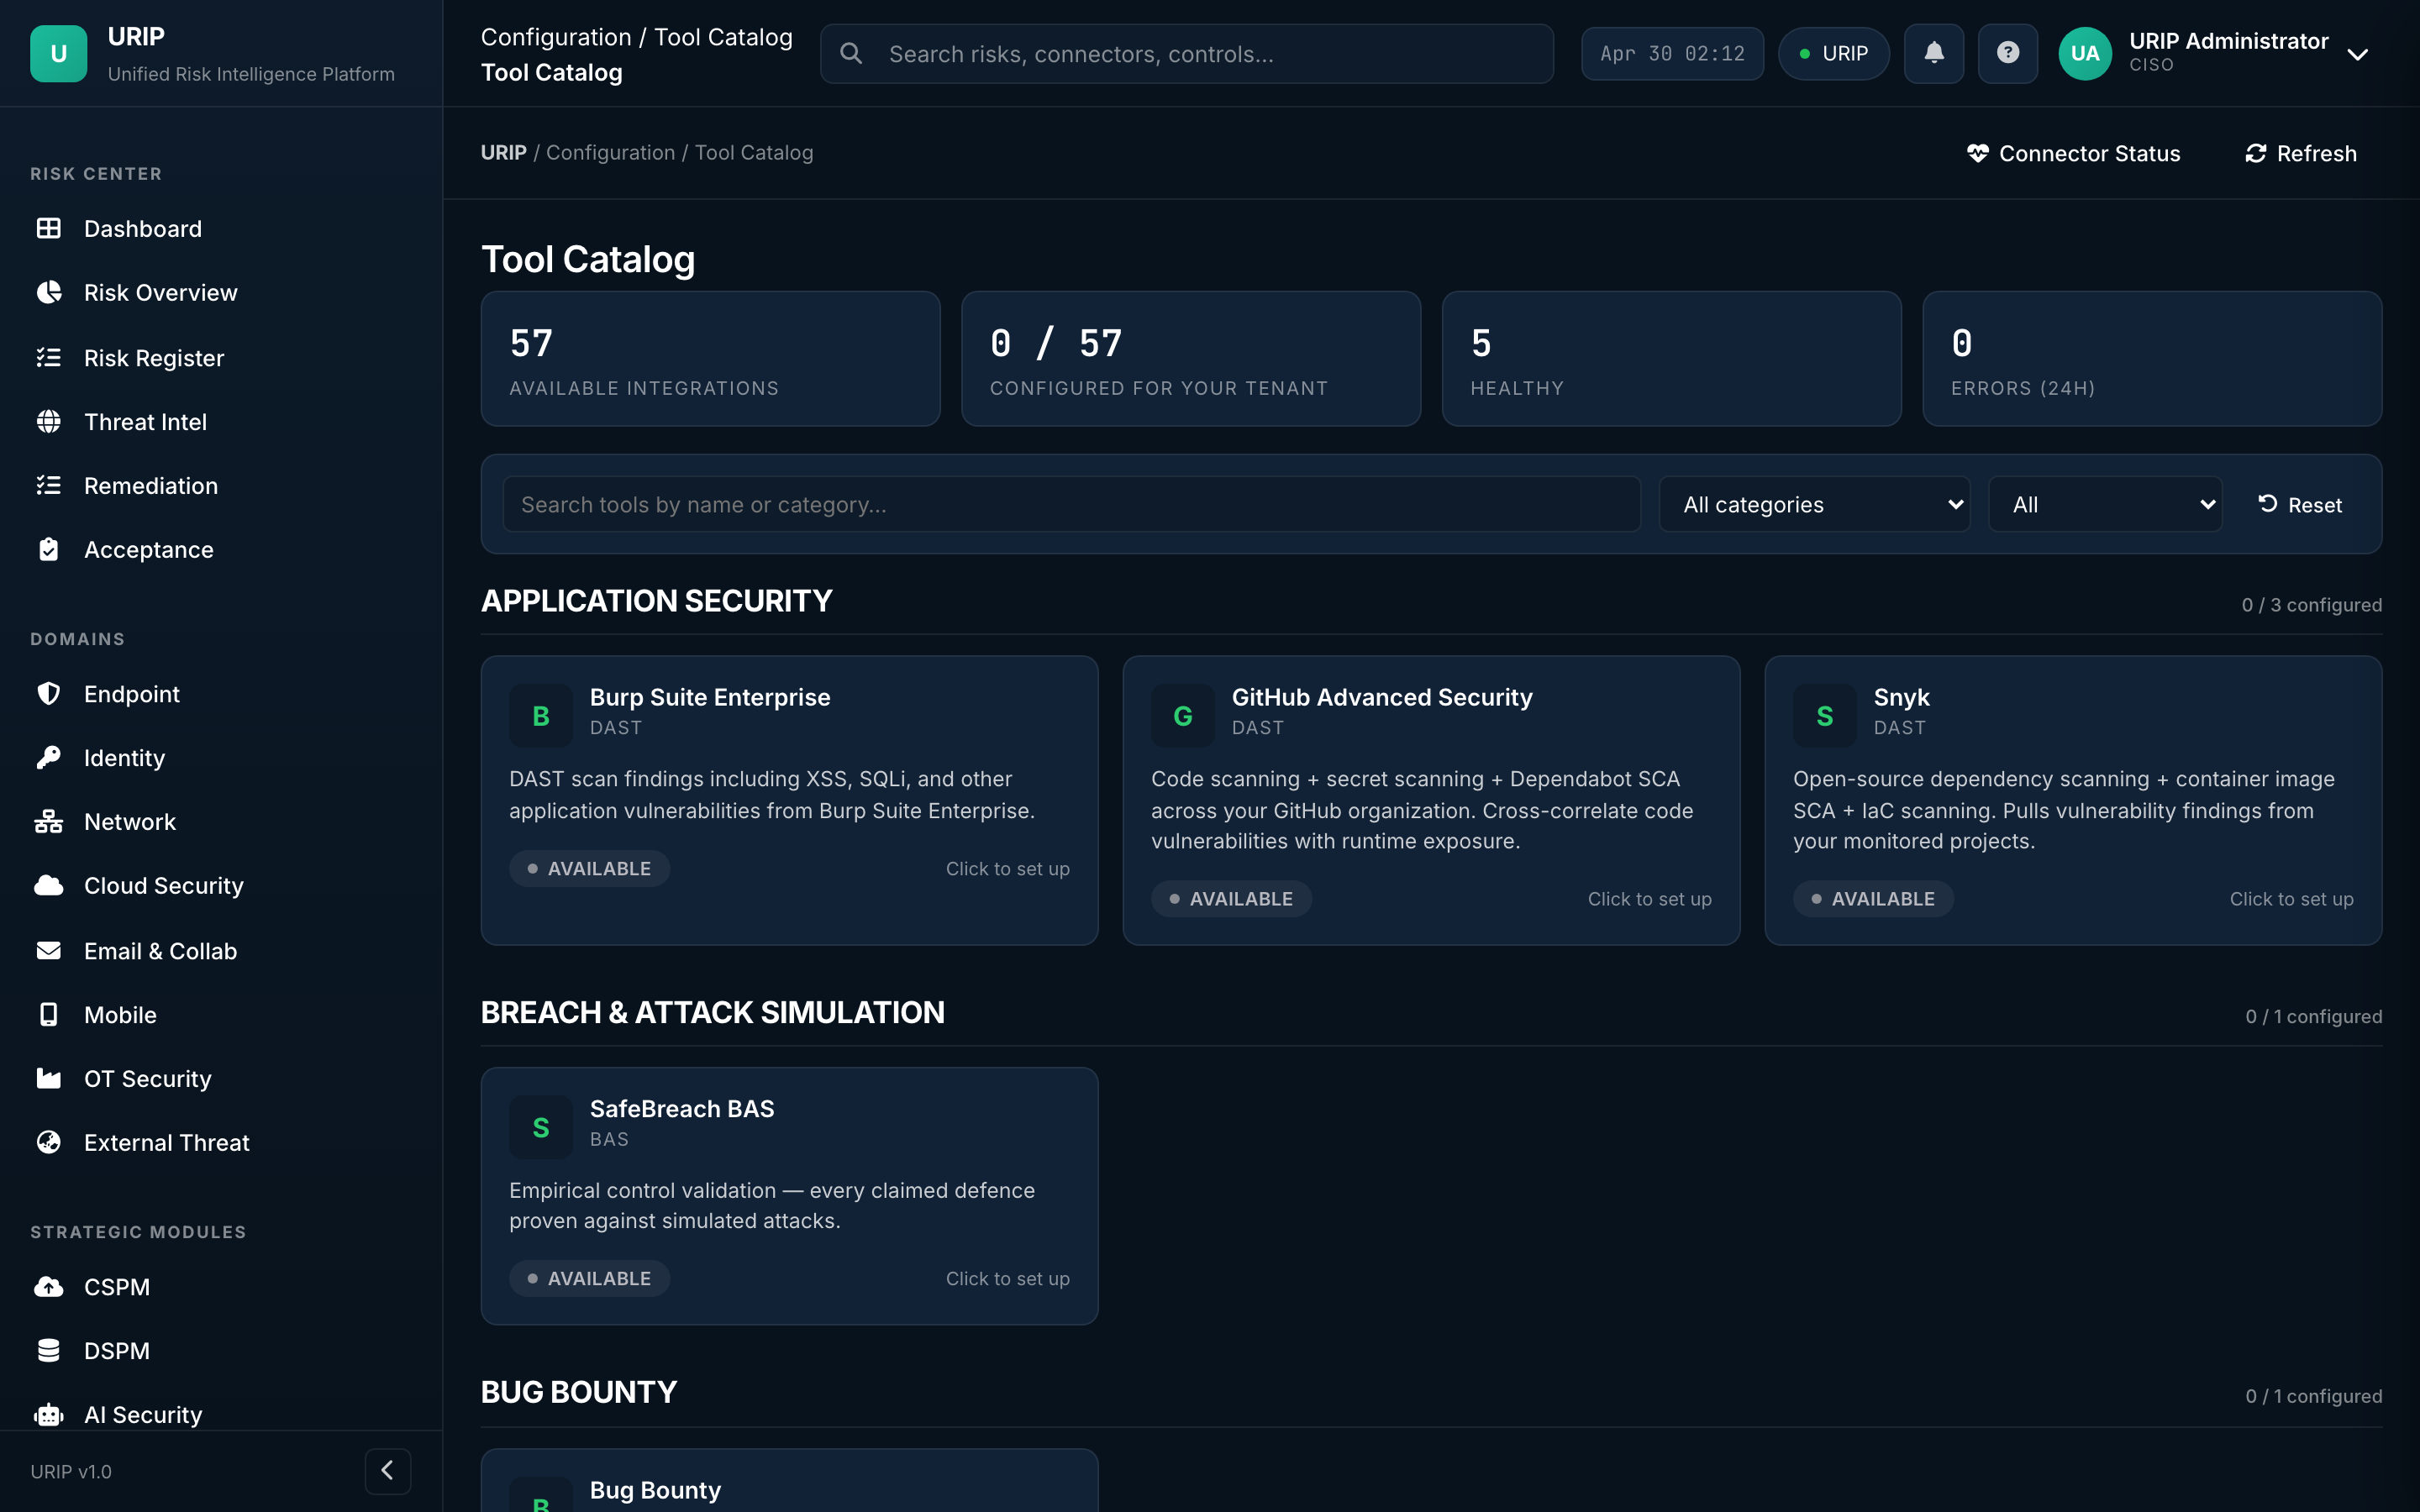
What it shows. Every supported integration (61 tools) grouped by category — EDR, VM, Cloud, Identity, SIEM, ZTNA, Email, Mobile, Backup, OT, etc. Each card shows the tool's logo, the categories it covers, and a Configure button.
What you do here. Pick the tool you own → click Configure → the wizard takes over.
Connector wizard
URL: /connector-wizard.html
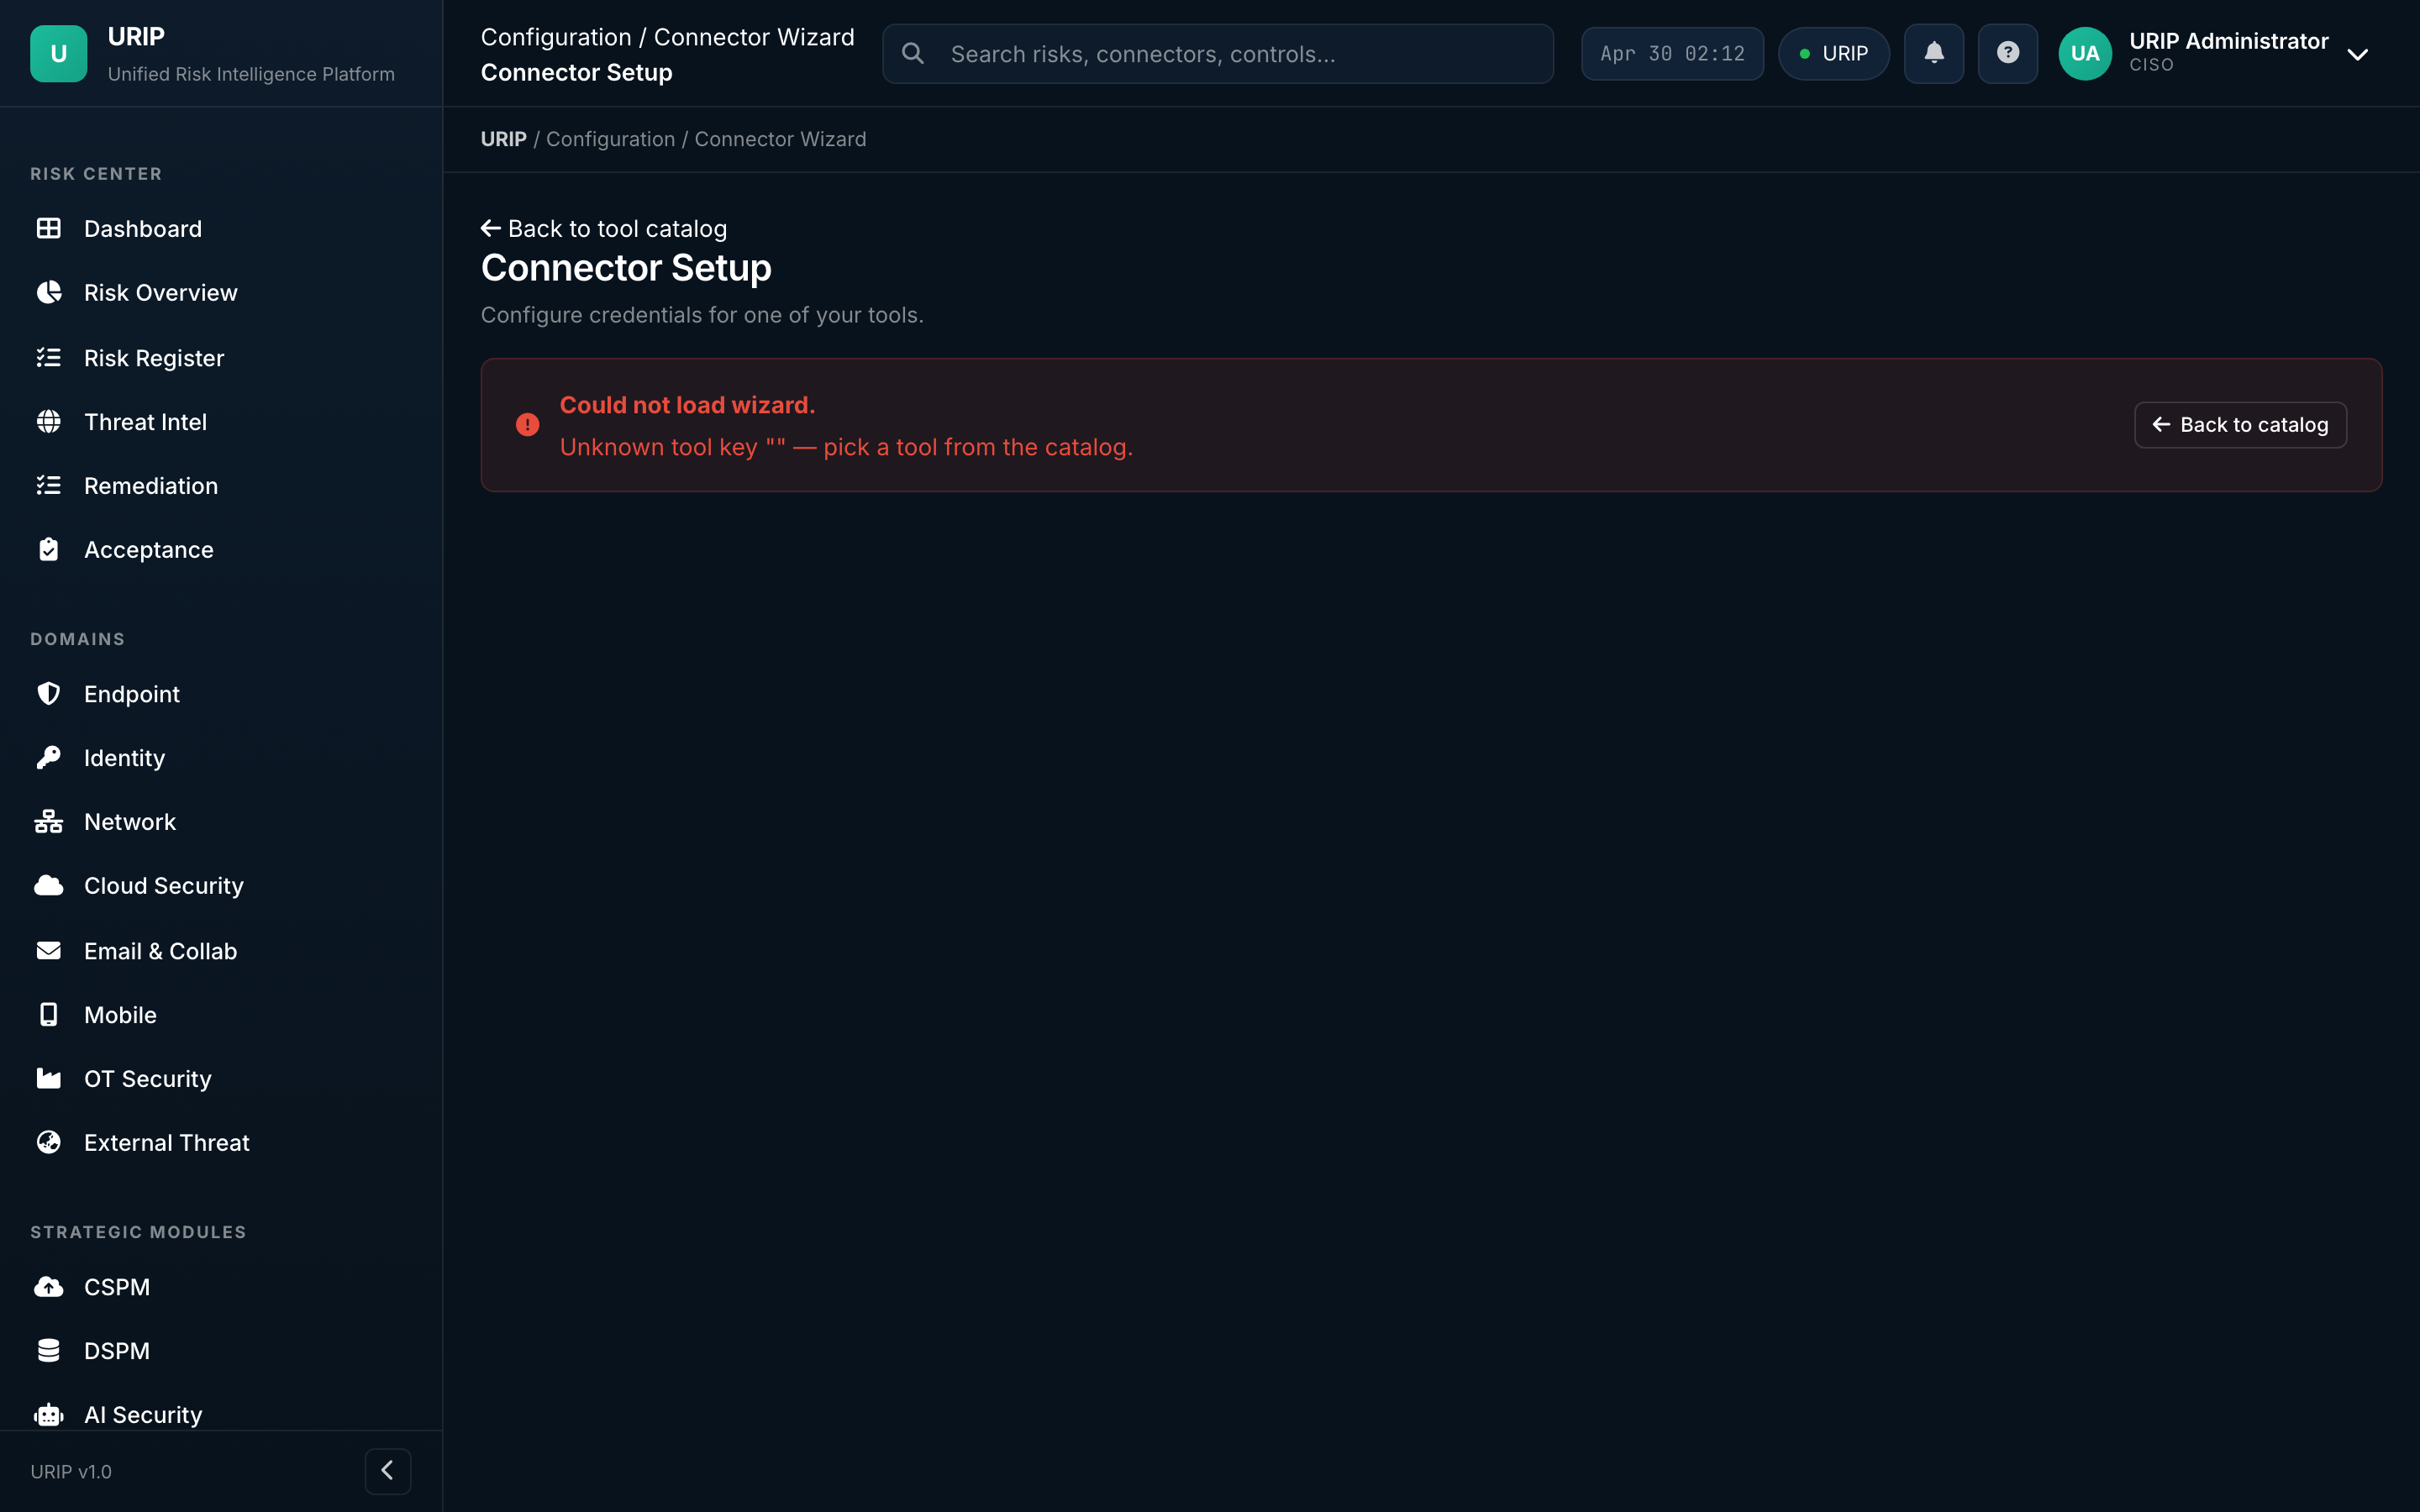
What it shows. Step-by-step setup form — credentials (API token / OAuth / service account), tenant URL, tag mapping, polling frequency. Validates the credential before saving.
What you do here. Paste your API token → click Test connection → on green, click Save. URIP then performs the first poll within 5 minutes.
Tool registration — what the right-side panel asks you for
When you click any tool in the catalogue, a slide-in panel opens with the exact inputs URIP needs for that vendor:
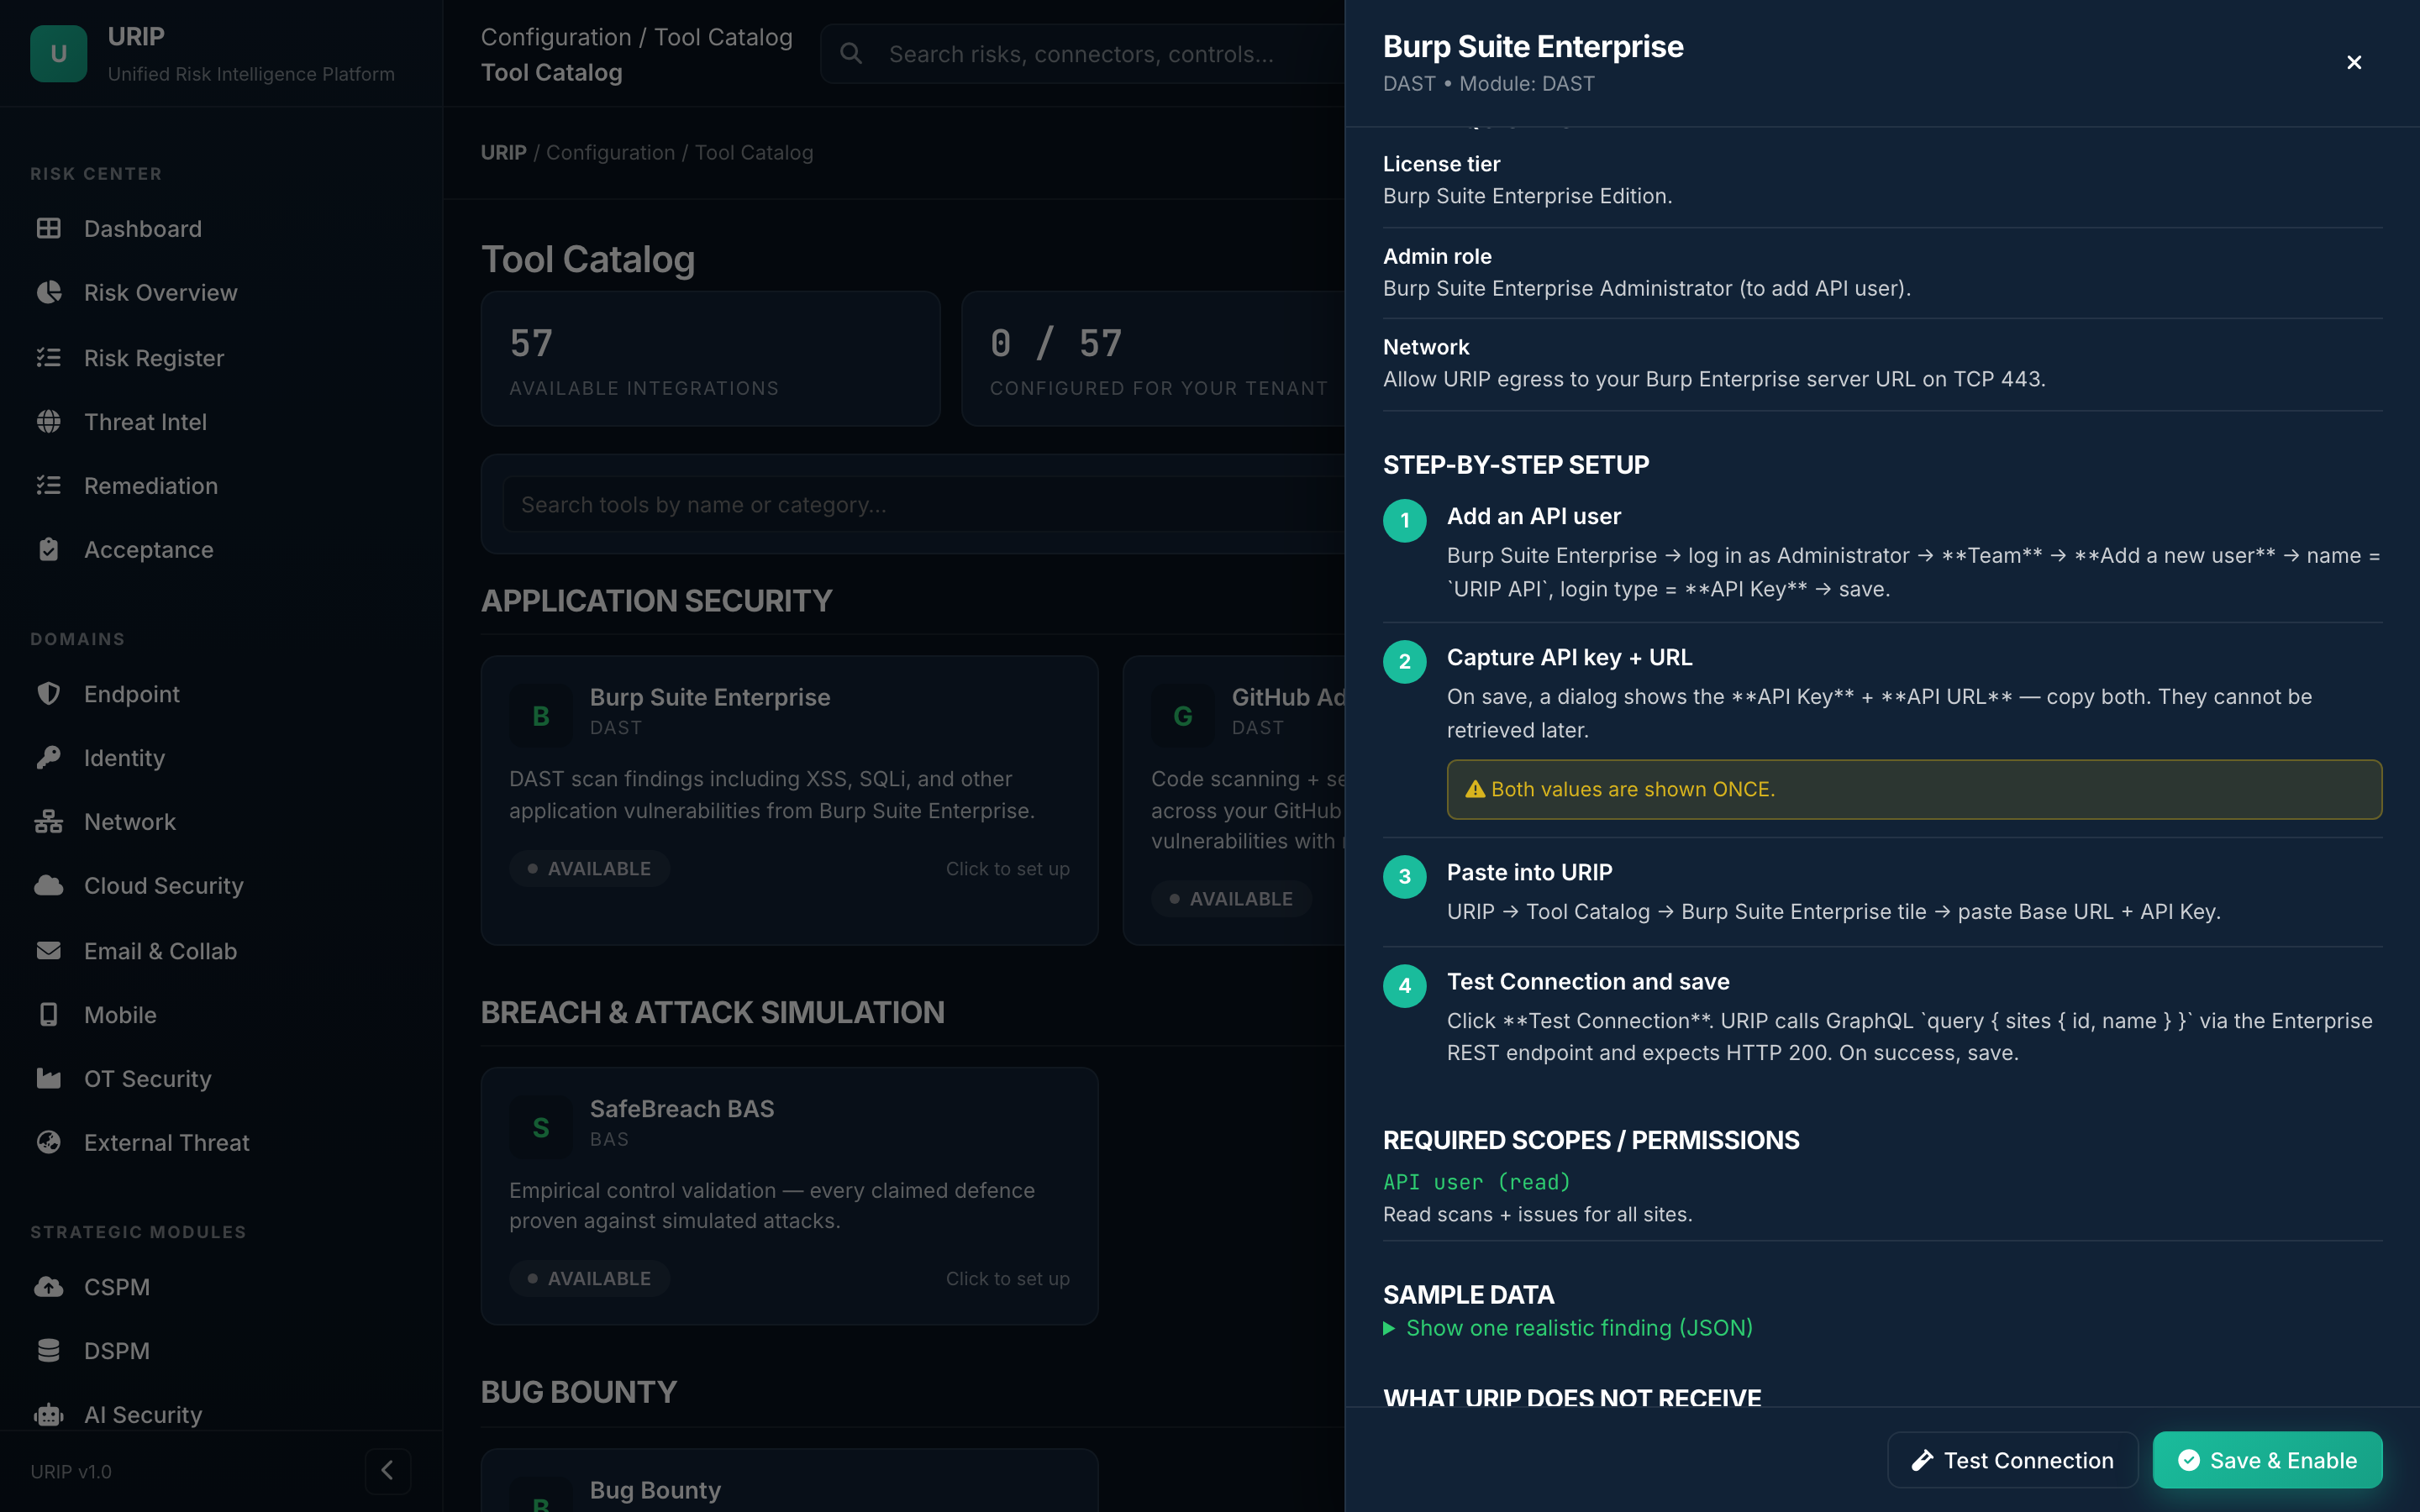
What the panel always shows: - License tier / admin role required — confirm your account on the vendor side meets the minimum (e.g. Burp Enterprise → Administrator / CrowdStrike → Falcon API client). - Network requirements — egress rules URIP needs (typical: HTTPS 443 to the vendor's tenant URL). - Step-by-step setup — (1) create the API user / OAuth app on the vendor side, (2) capture the API key + base URL — note the warning: "Both values are shown ONCE", (3) paste them into URIP, (4) click Test Connection → on green, Save & Enable. - Required scopes / permissions — the exact OAuth scopes or API roles URIP requests (linked to the vendor's docs). - Sample data — a real-world example finding so you can see what URIP will pull before you commit credentials. - Footer buttons — Test Connection (read-only probe, doesn't write anything to your tenant) and Save & Enable (only enabled after a green test).
The panel is the same shape for every tool — only the field names change (e.g. CrowdStrike asks for Client ID + Secret + Cloud region; Tenable asks for Access Key + Secret Key + Site URL; AWS asks for Role ARN + External ID).
Connector status
URL: /connector-status.html
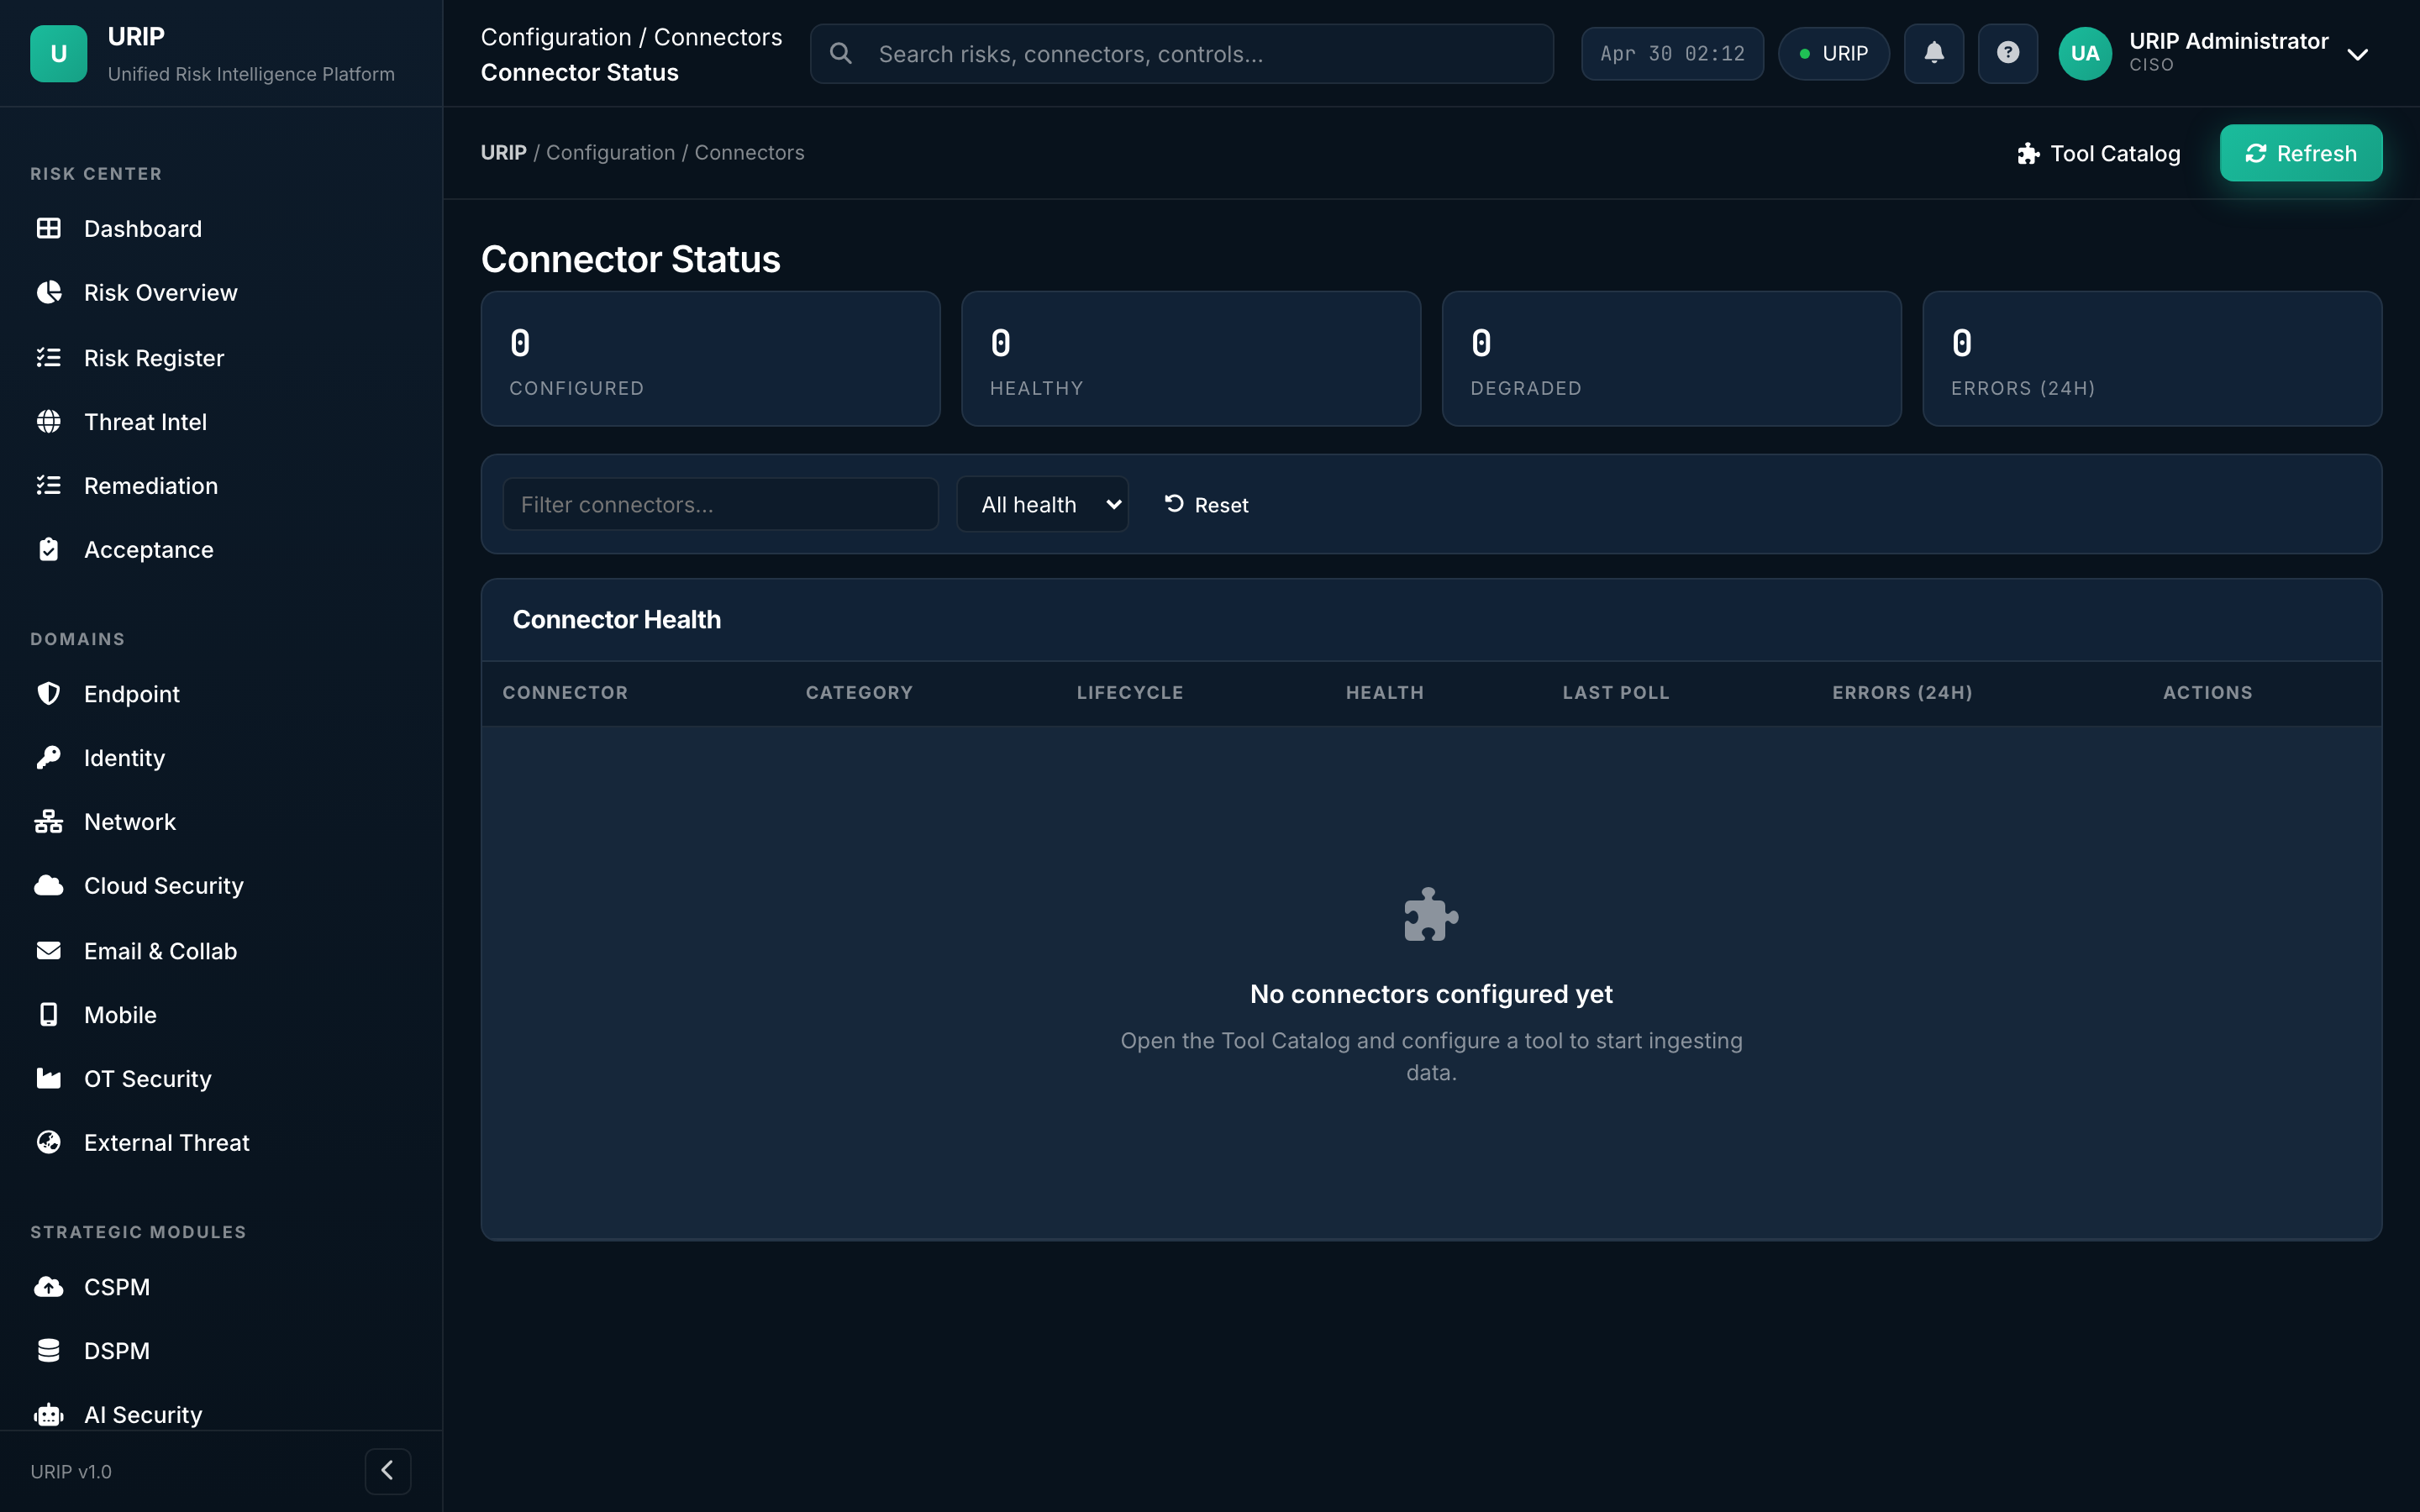
What it shows. Health of every wired connector — last successful poll, next scheduled poll, finding count last 24 h, error count last 24 h, average rate-limit headroom.
What you do here. Spot the red row → click → see the error message and the fix path. Rotate credentials here on credential expiry.
Admin overview
URL: /admin-modules.html
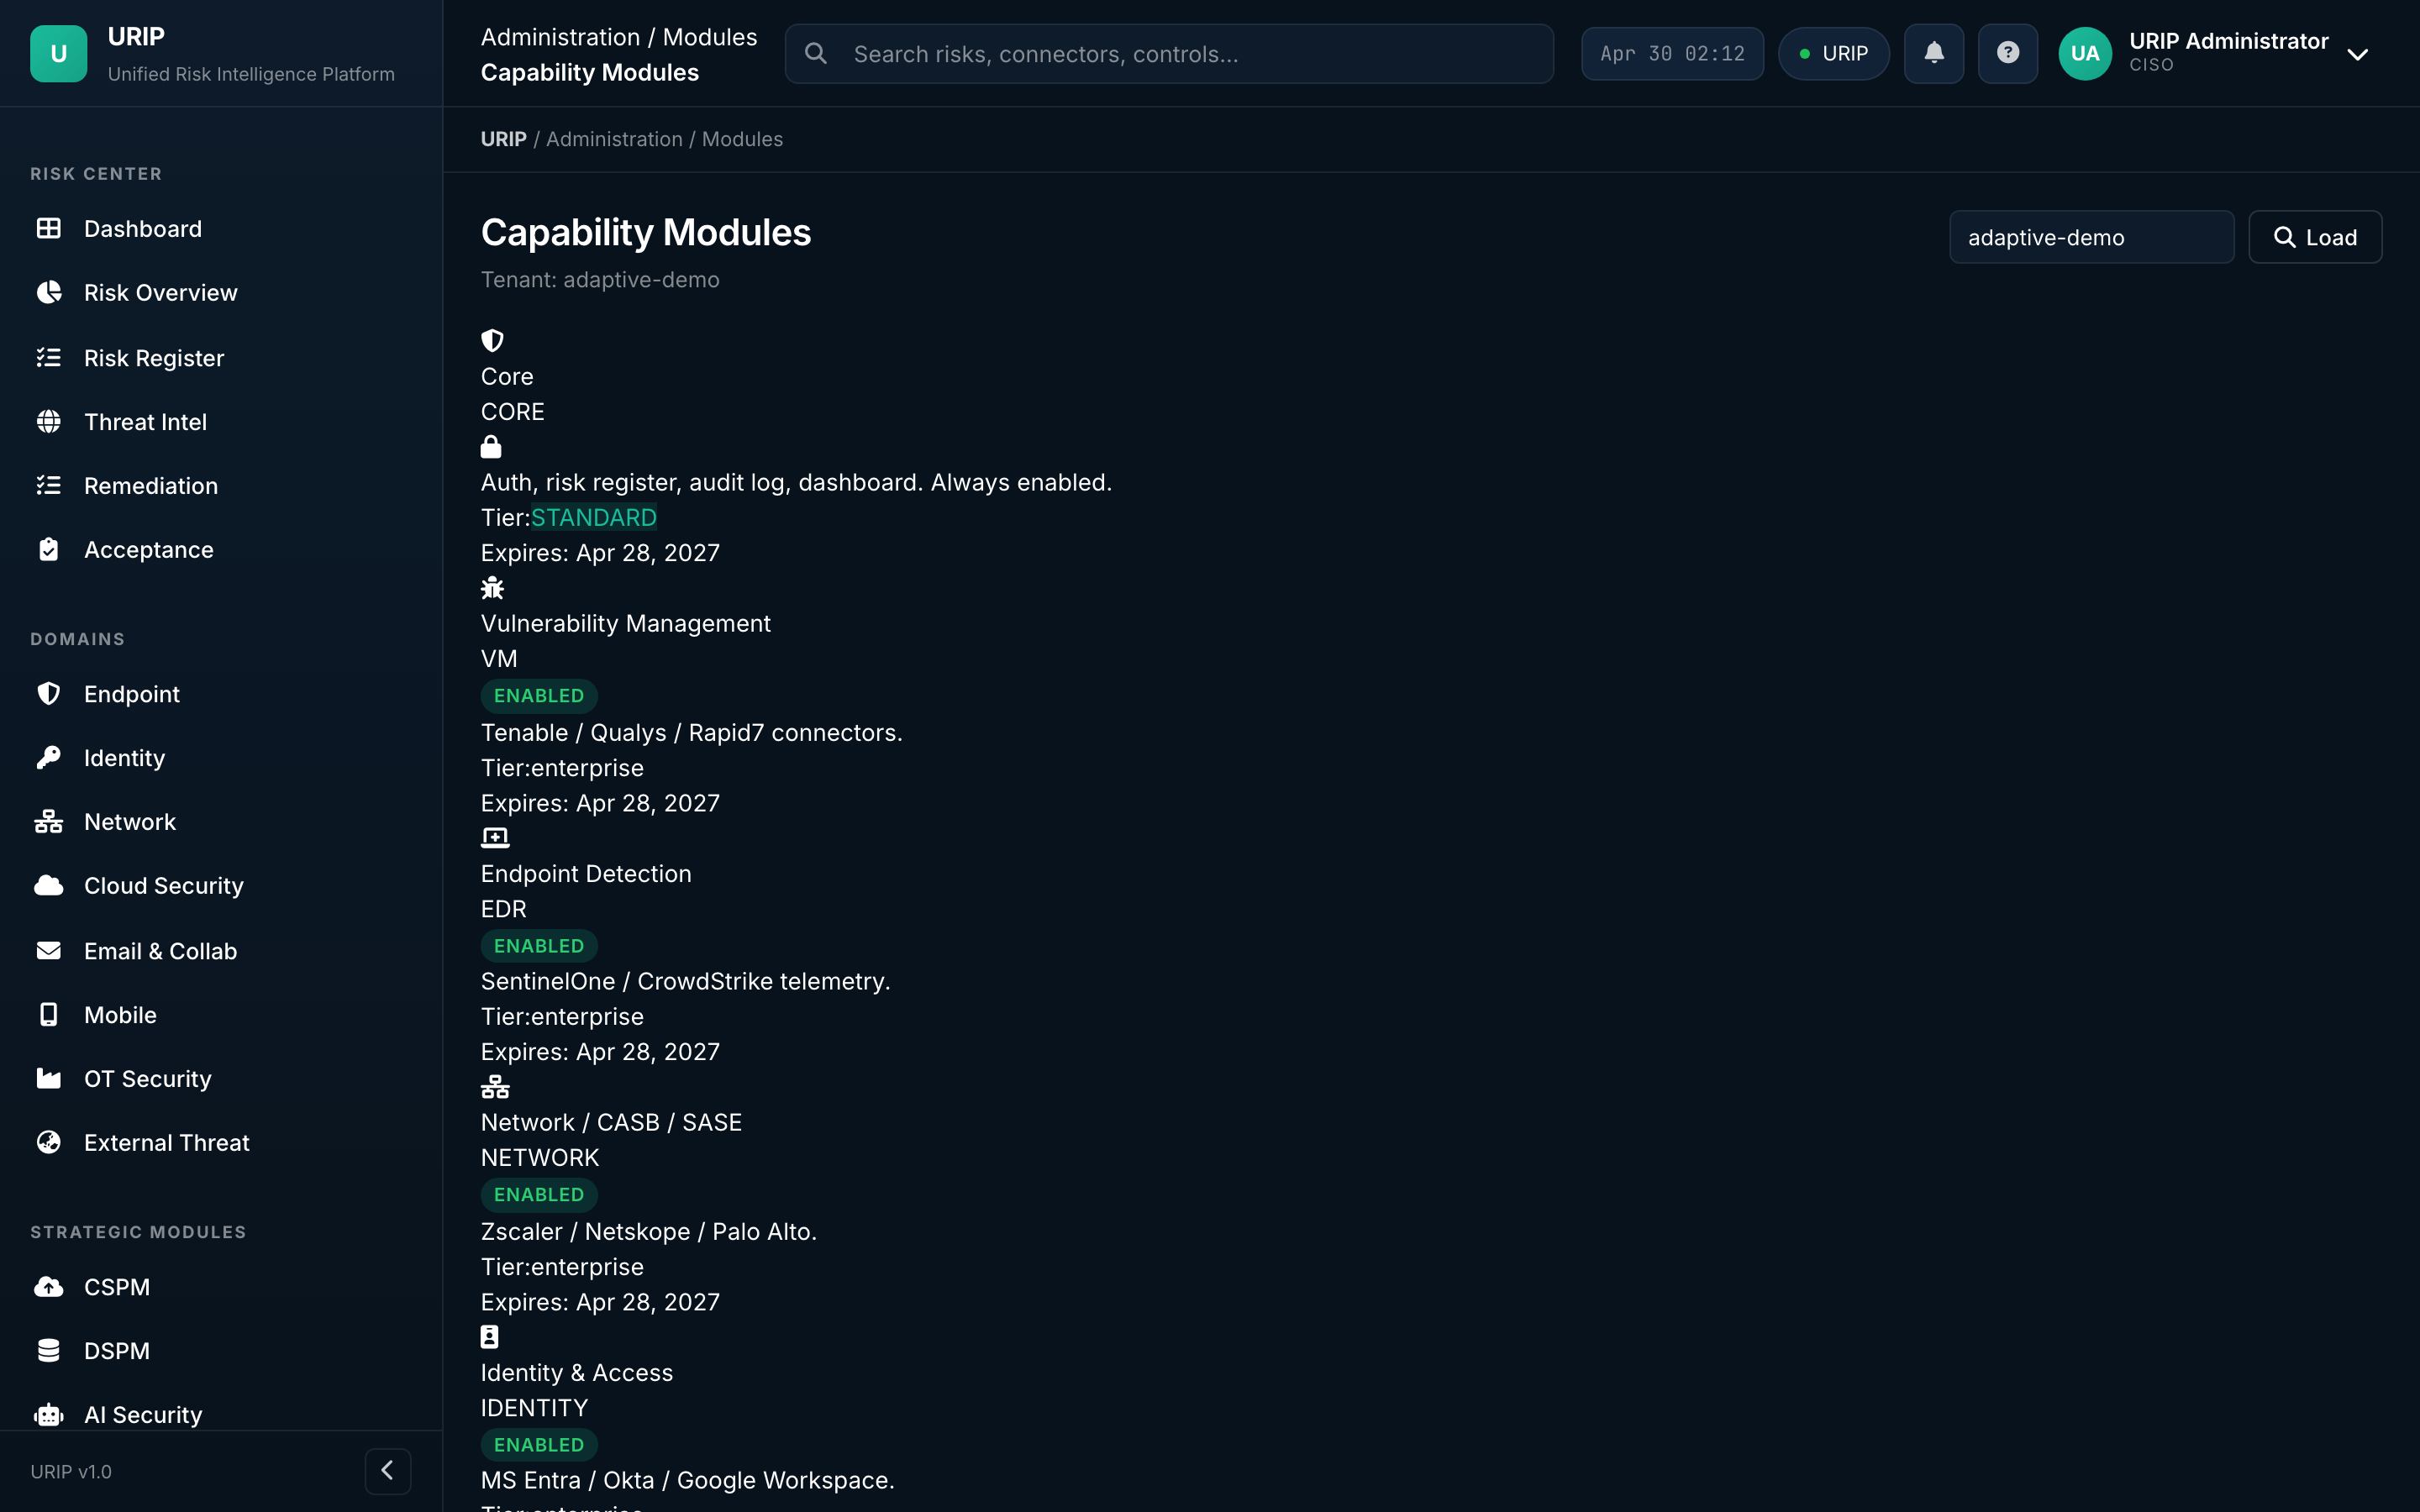
What it shows. (Super-admin only) Module licence status — which modules (CSPM, DSPM, AI Sec, ZTNA, Attack Path, Risk Quant, VAPT, Compliance) are enabled for this tenant, expiry dates, seat counts. Risk-scoring weight tuning, multi-tenant management, and VAPT inbox triage live in adjacent admin tabs (/admin-scoring, /admin-tenants, /admin-vapt).
VAPT submissions inbox
URL: /admin-vapt.html
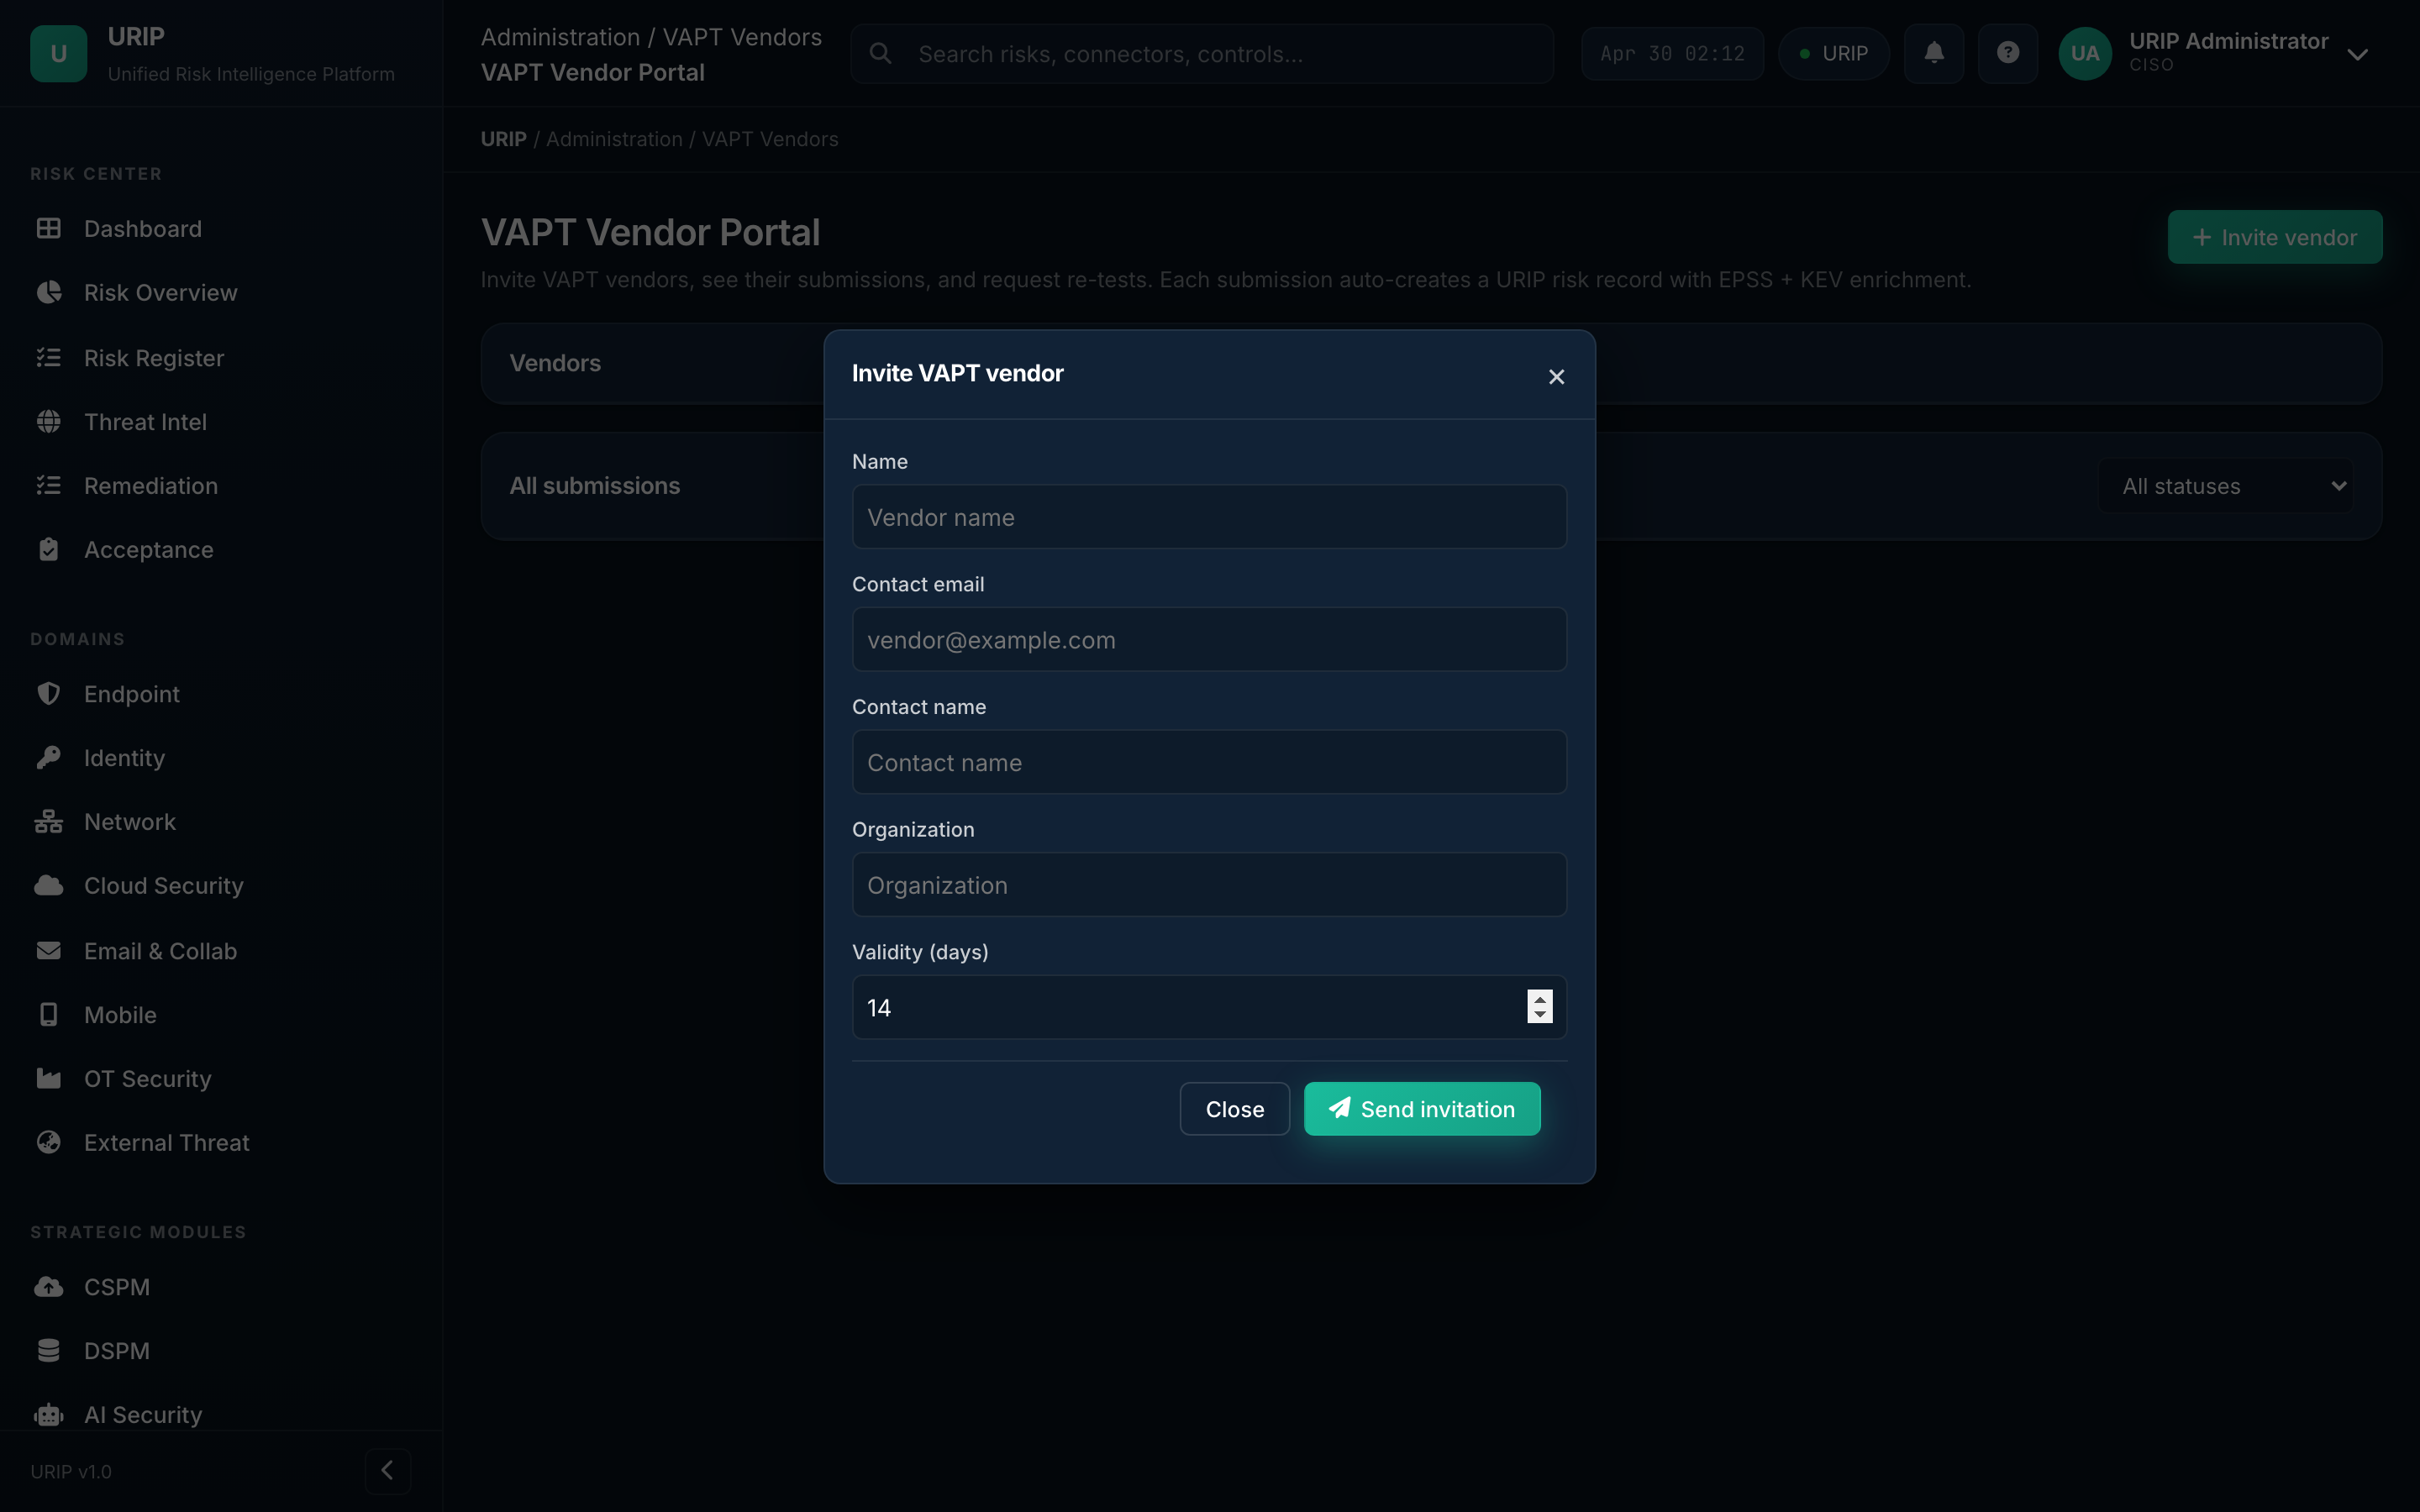
What it shows. Inbox of pen-test vendor submissions — accept into the Risk Register, reject with reason, or request more detail from the vendor. Vendors submit through their own portal at /vapt-portal-dashboard (separate sign-in).
7. Compliance suite
URIP's compliance dashboard sits inside the same shell as the risk pages — no second login, same data. Twenty pre-built frameworks; one URIP control library mapped to all of them. External-auditor workflows (invitations, scoped portal, evidence sign-off) are documented in the dedicated Auditor Portal Guide.
Frameworks
URL: /compliance-frameworks.html
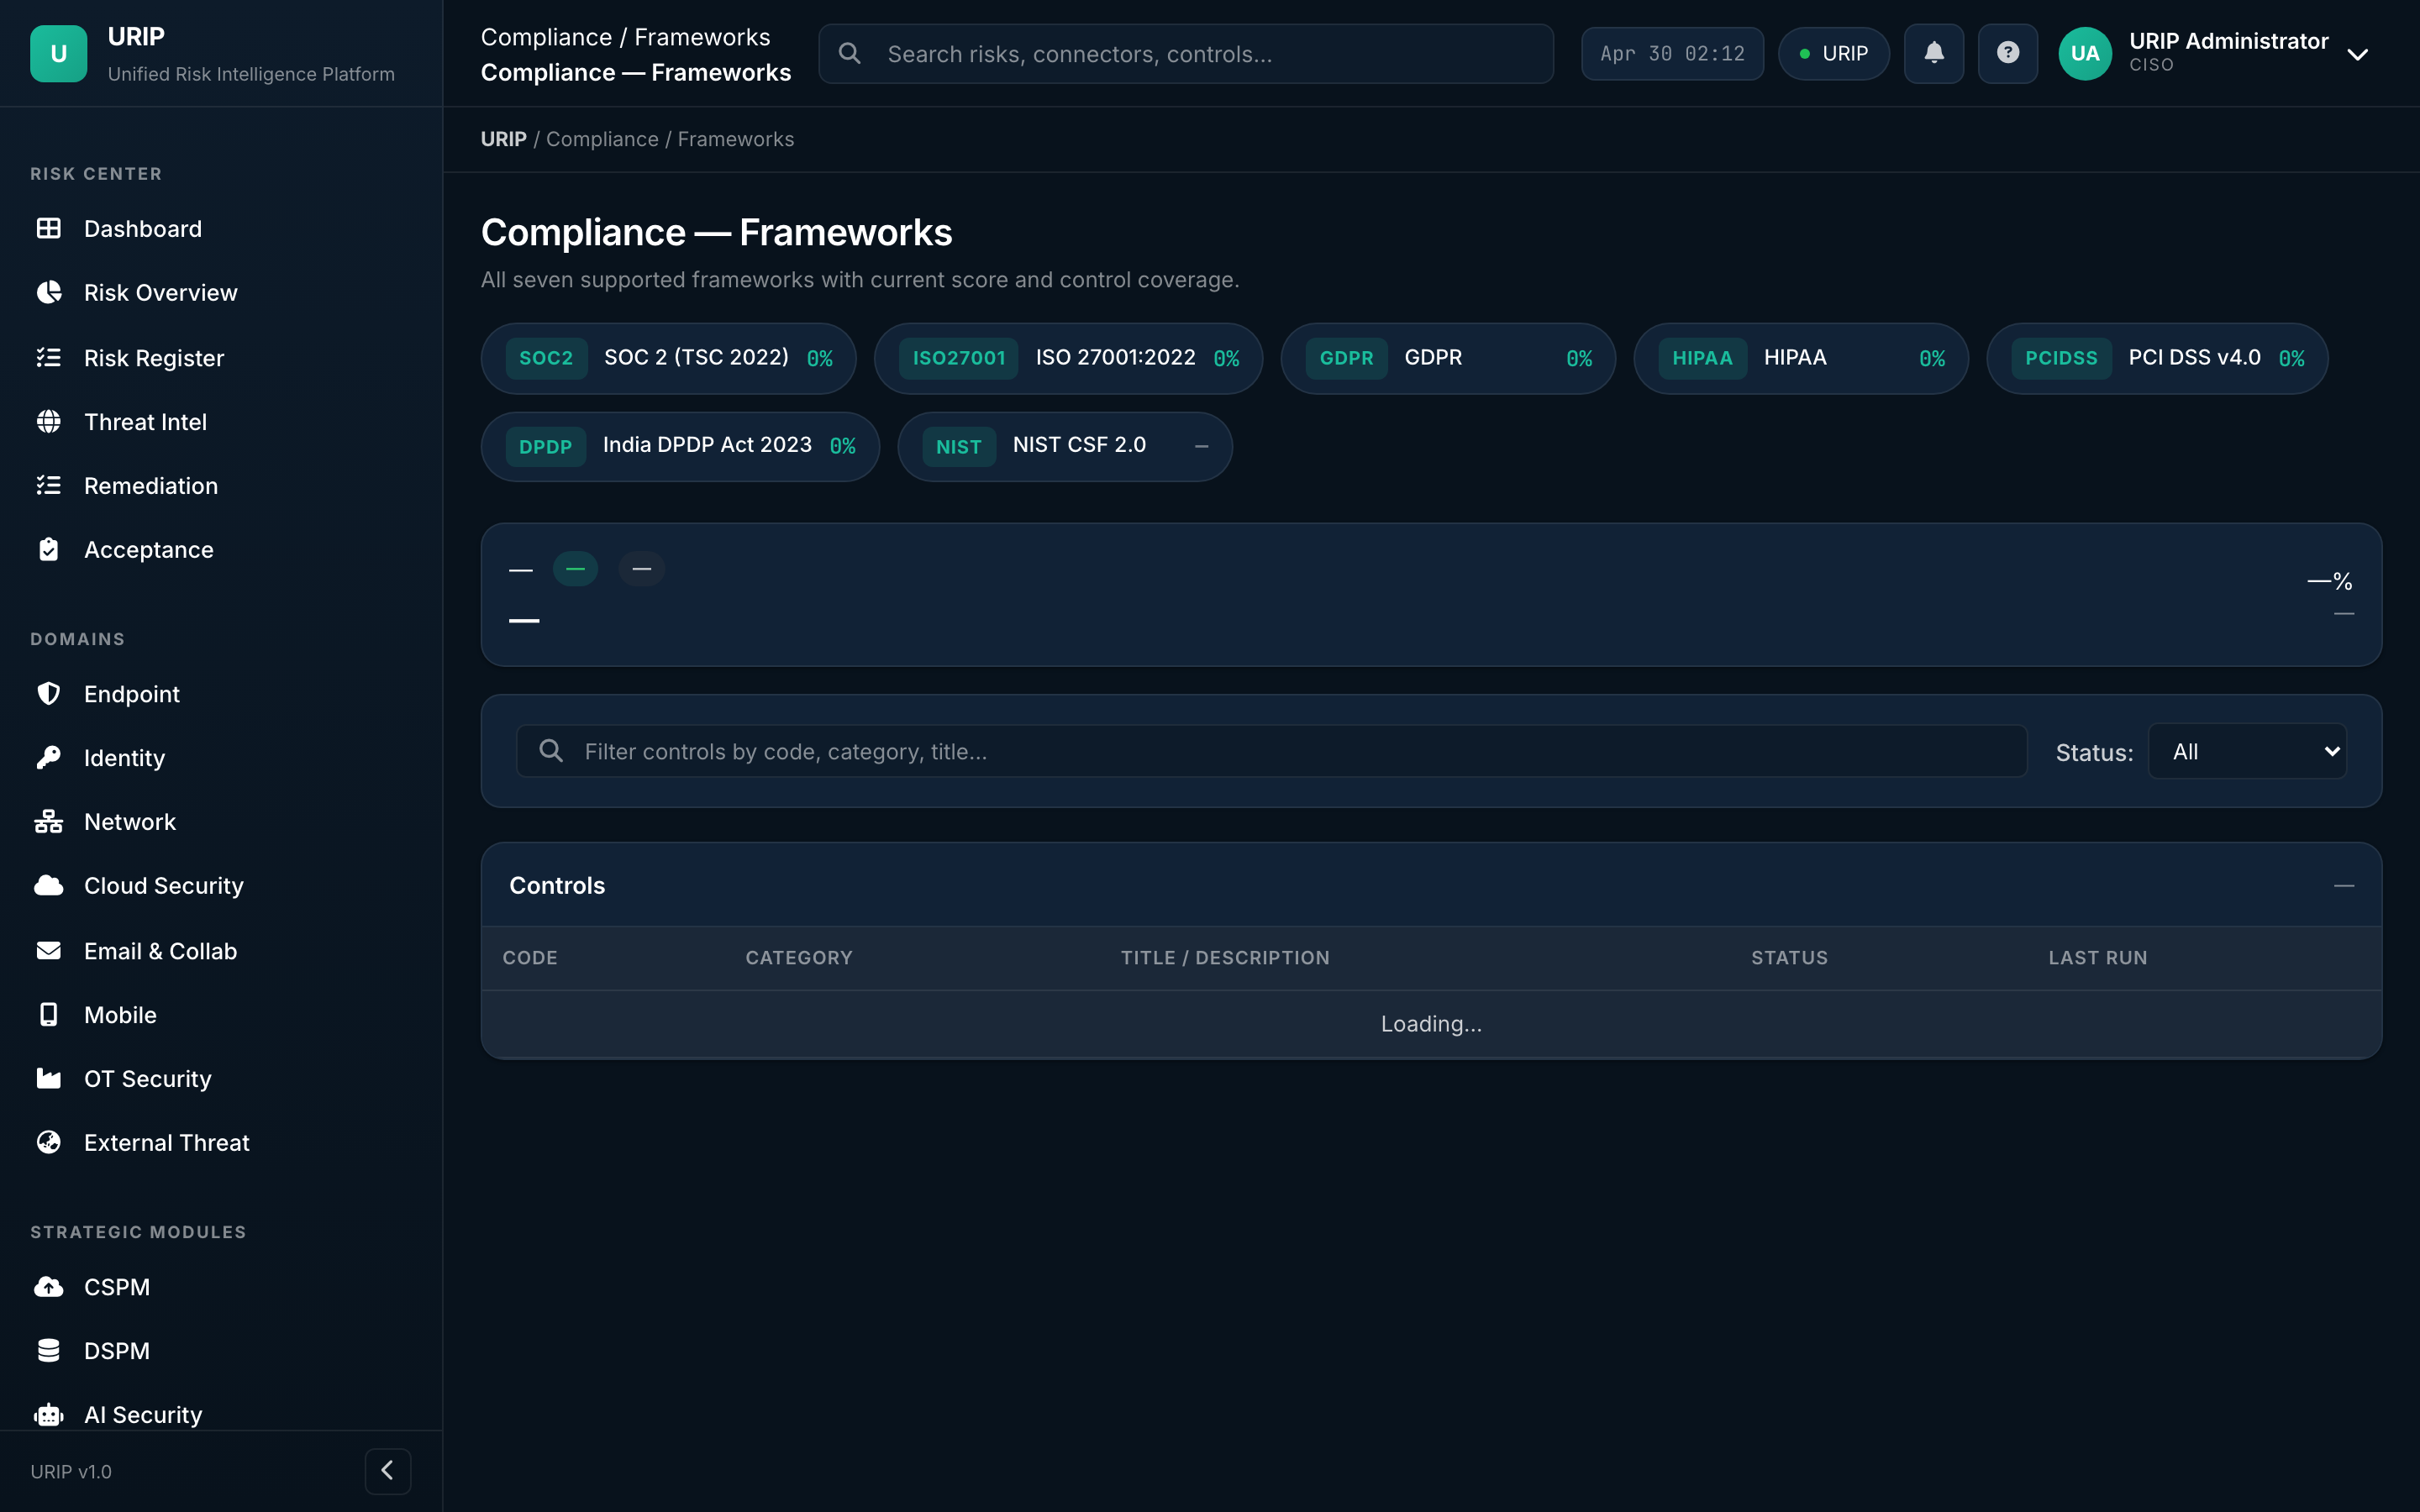
What it shows. Activated frameworks (SOC 2, ISO 27001, PCI DSS 4.0, HIPAA, NIST CSF 2.0, etc.) with current grade (A / B / C / D / F), control coverage percentage, and next audit date.
What you do here. Activate or deactivate frameworks, drill into any framework to see its controls.
Controls
URL: /compliance-controls.html
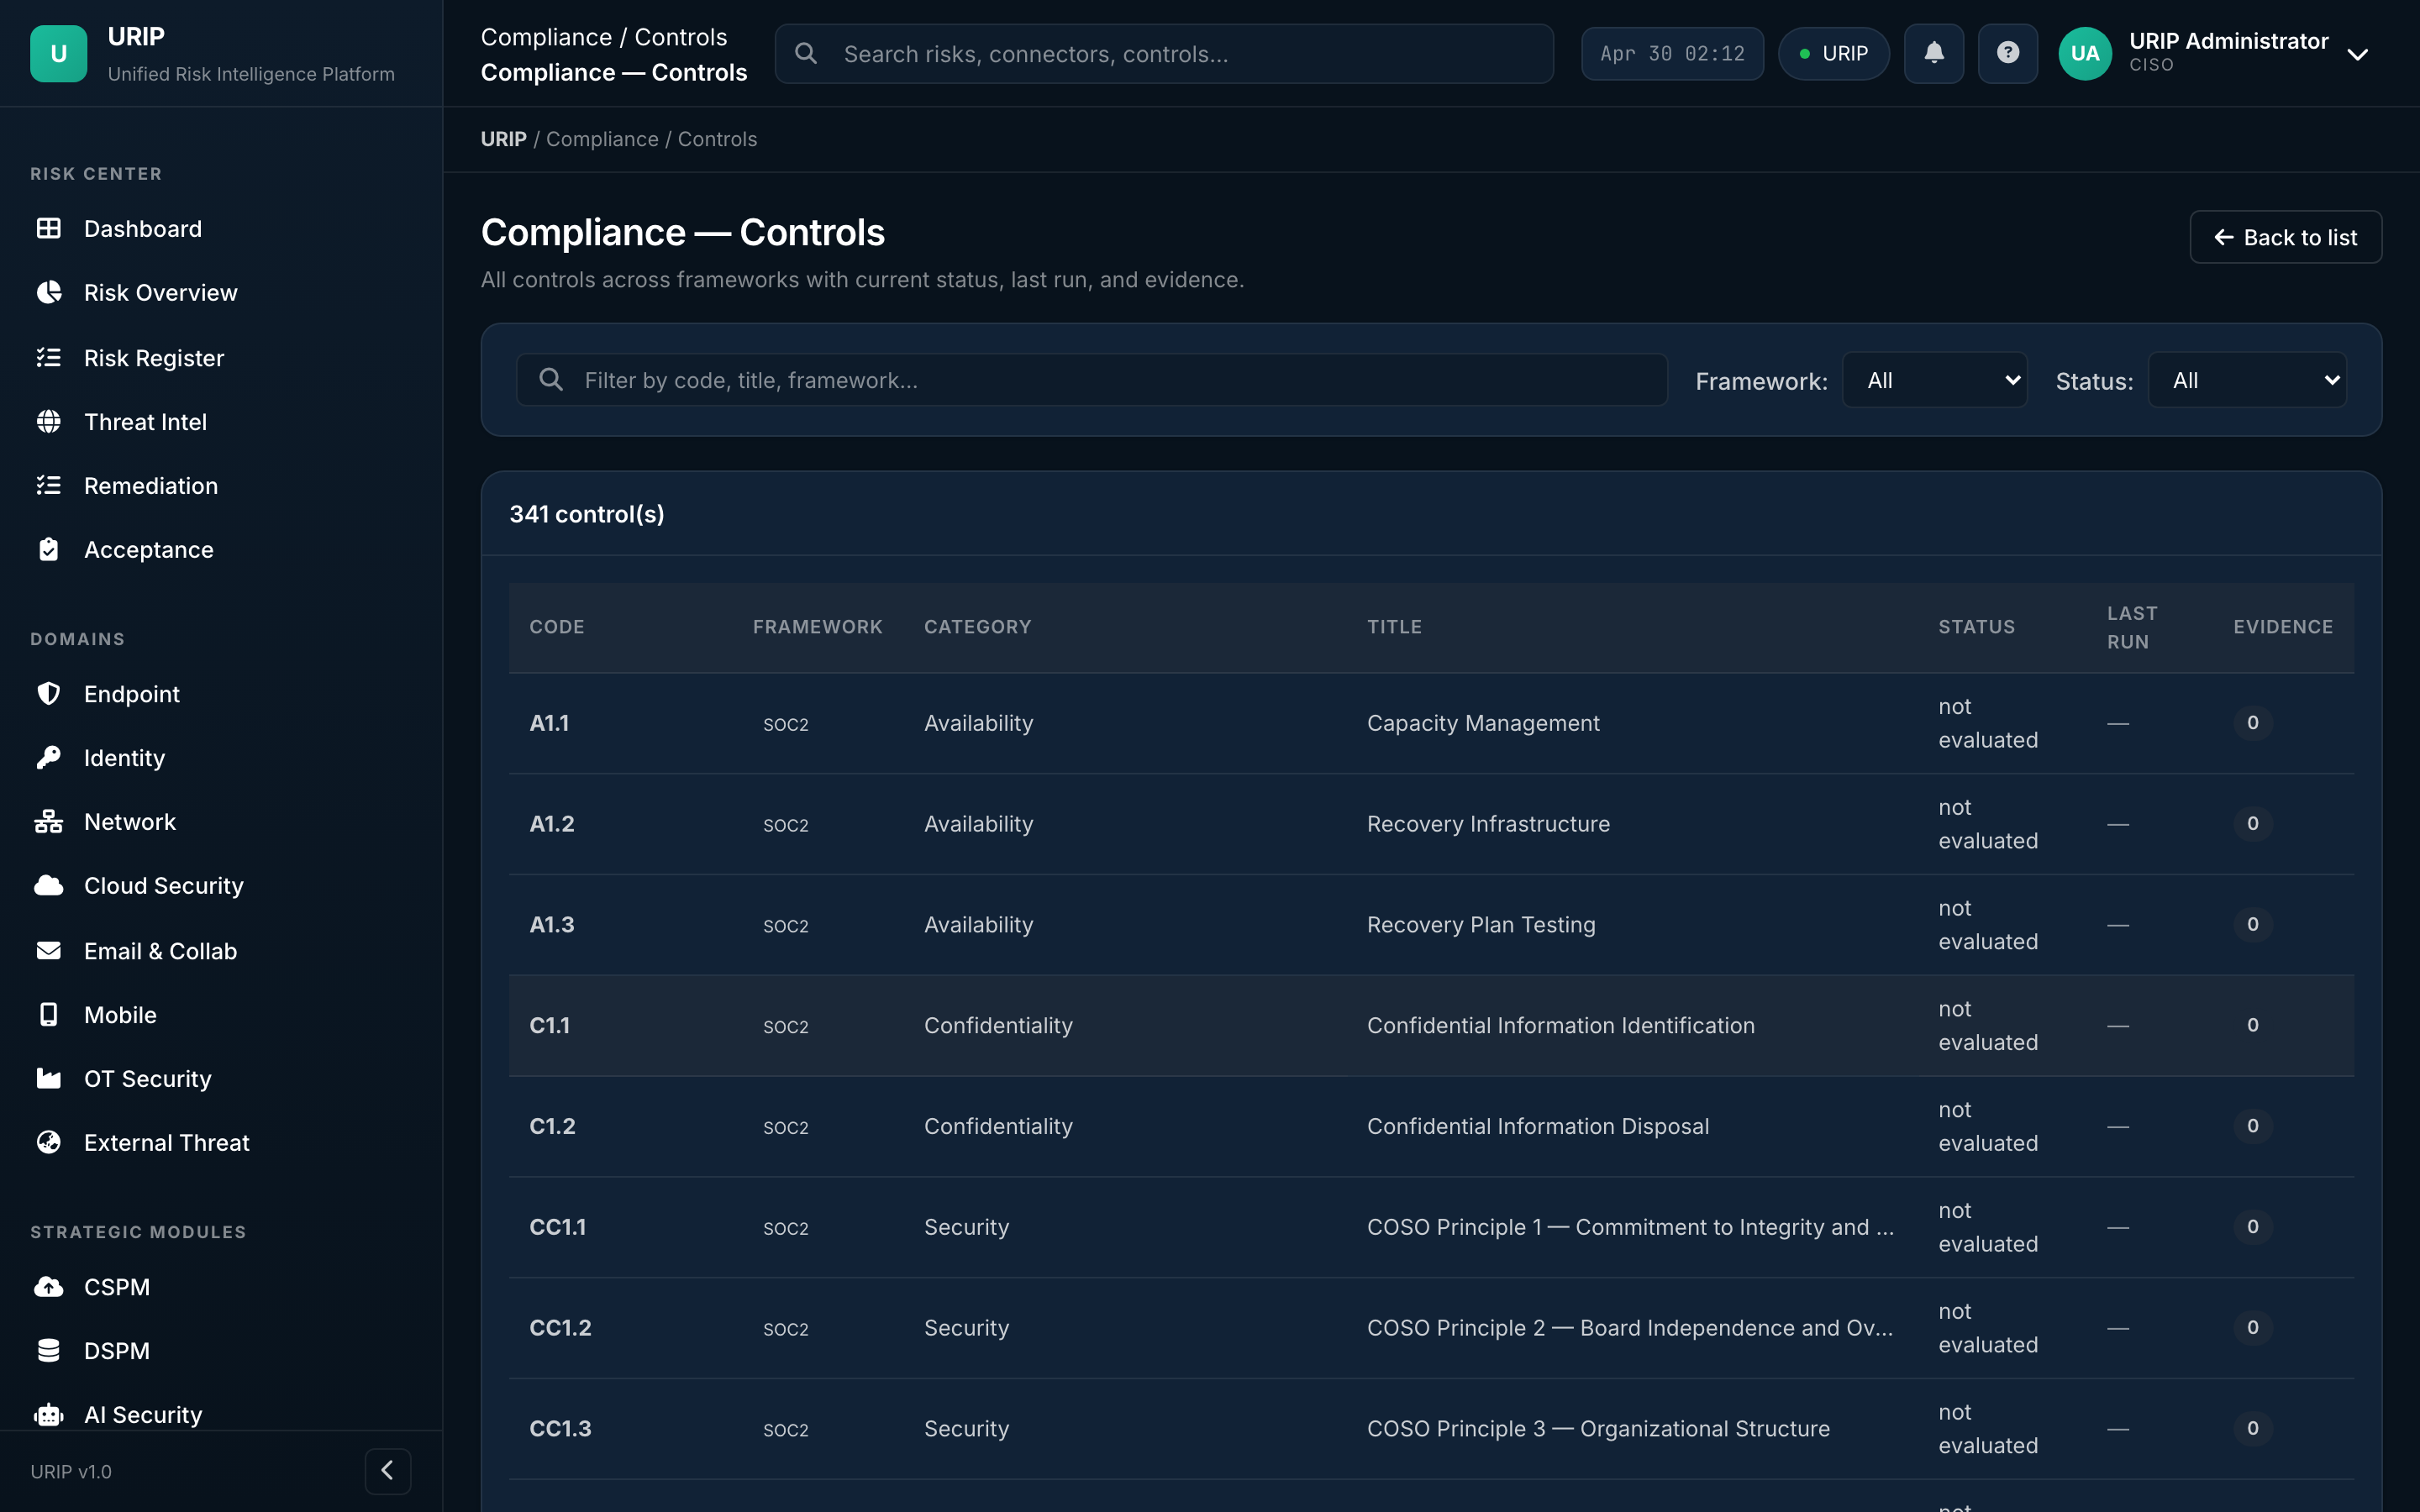
What it shows. Every control across every active framework — pass / fail / partial, last test date, evidence count, owner. Filter by framework, family, owner, or status.
Policies
URL: /compliance-policies.html
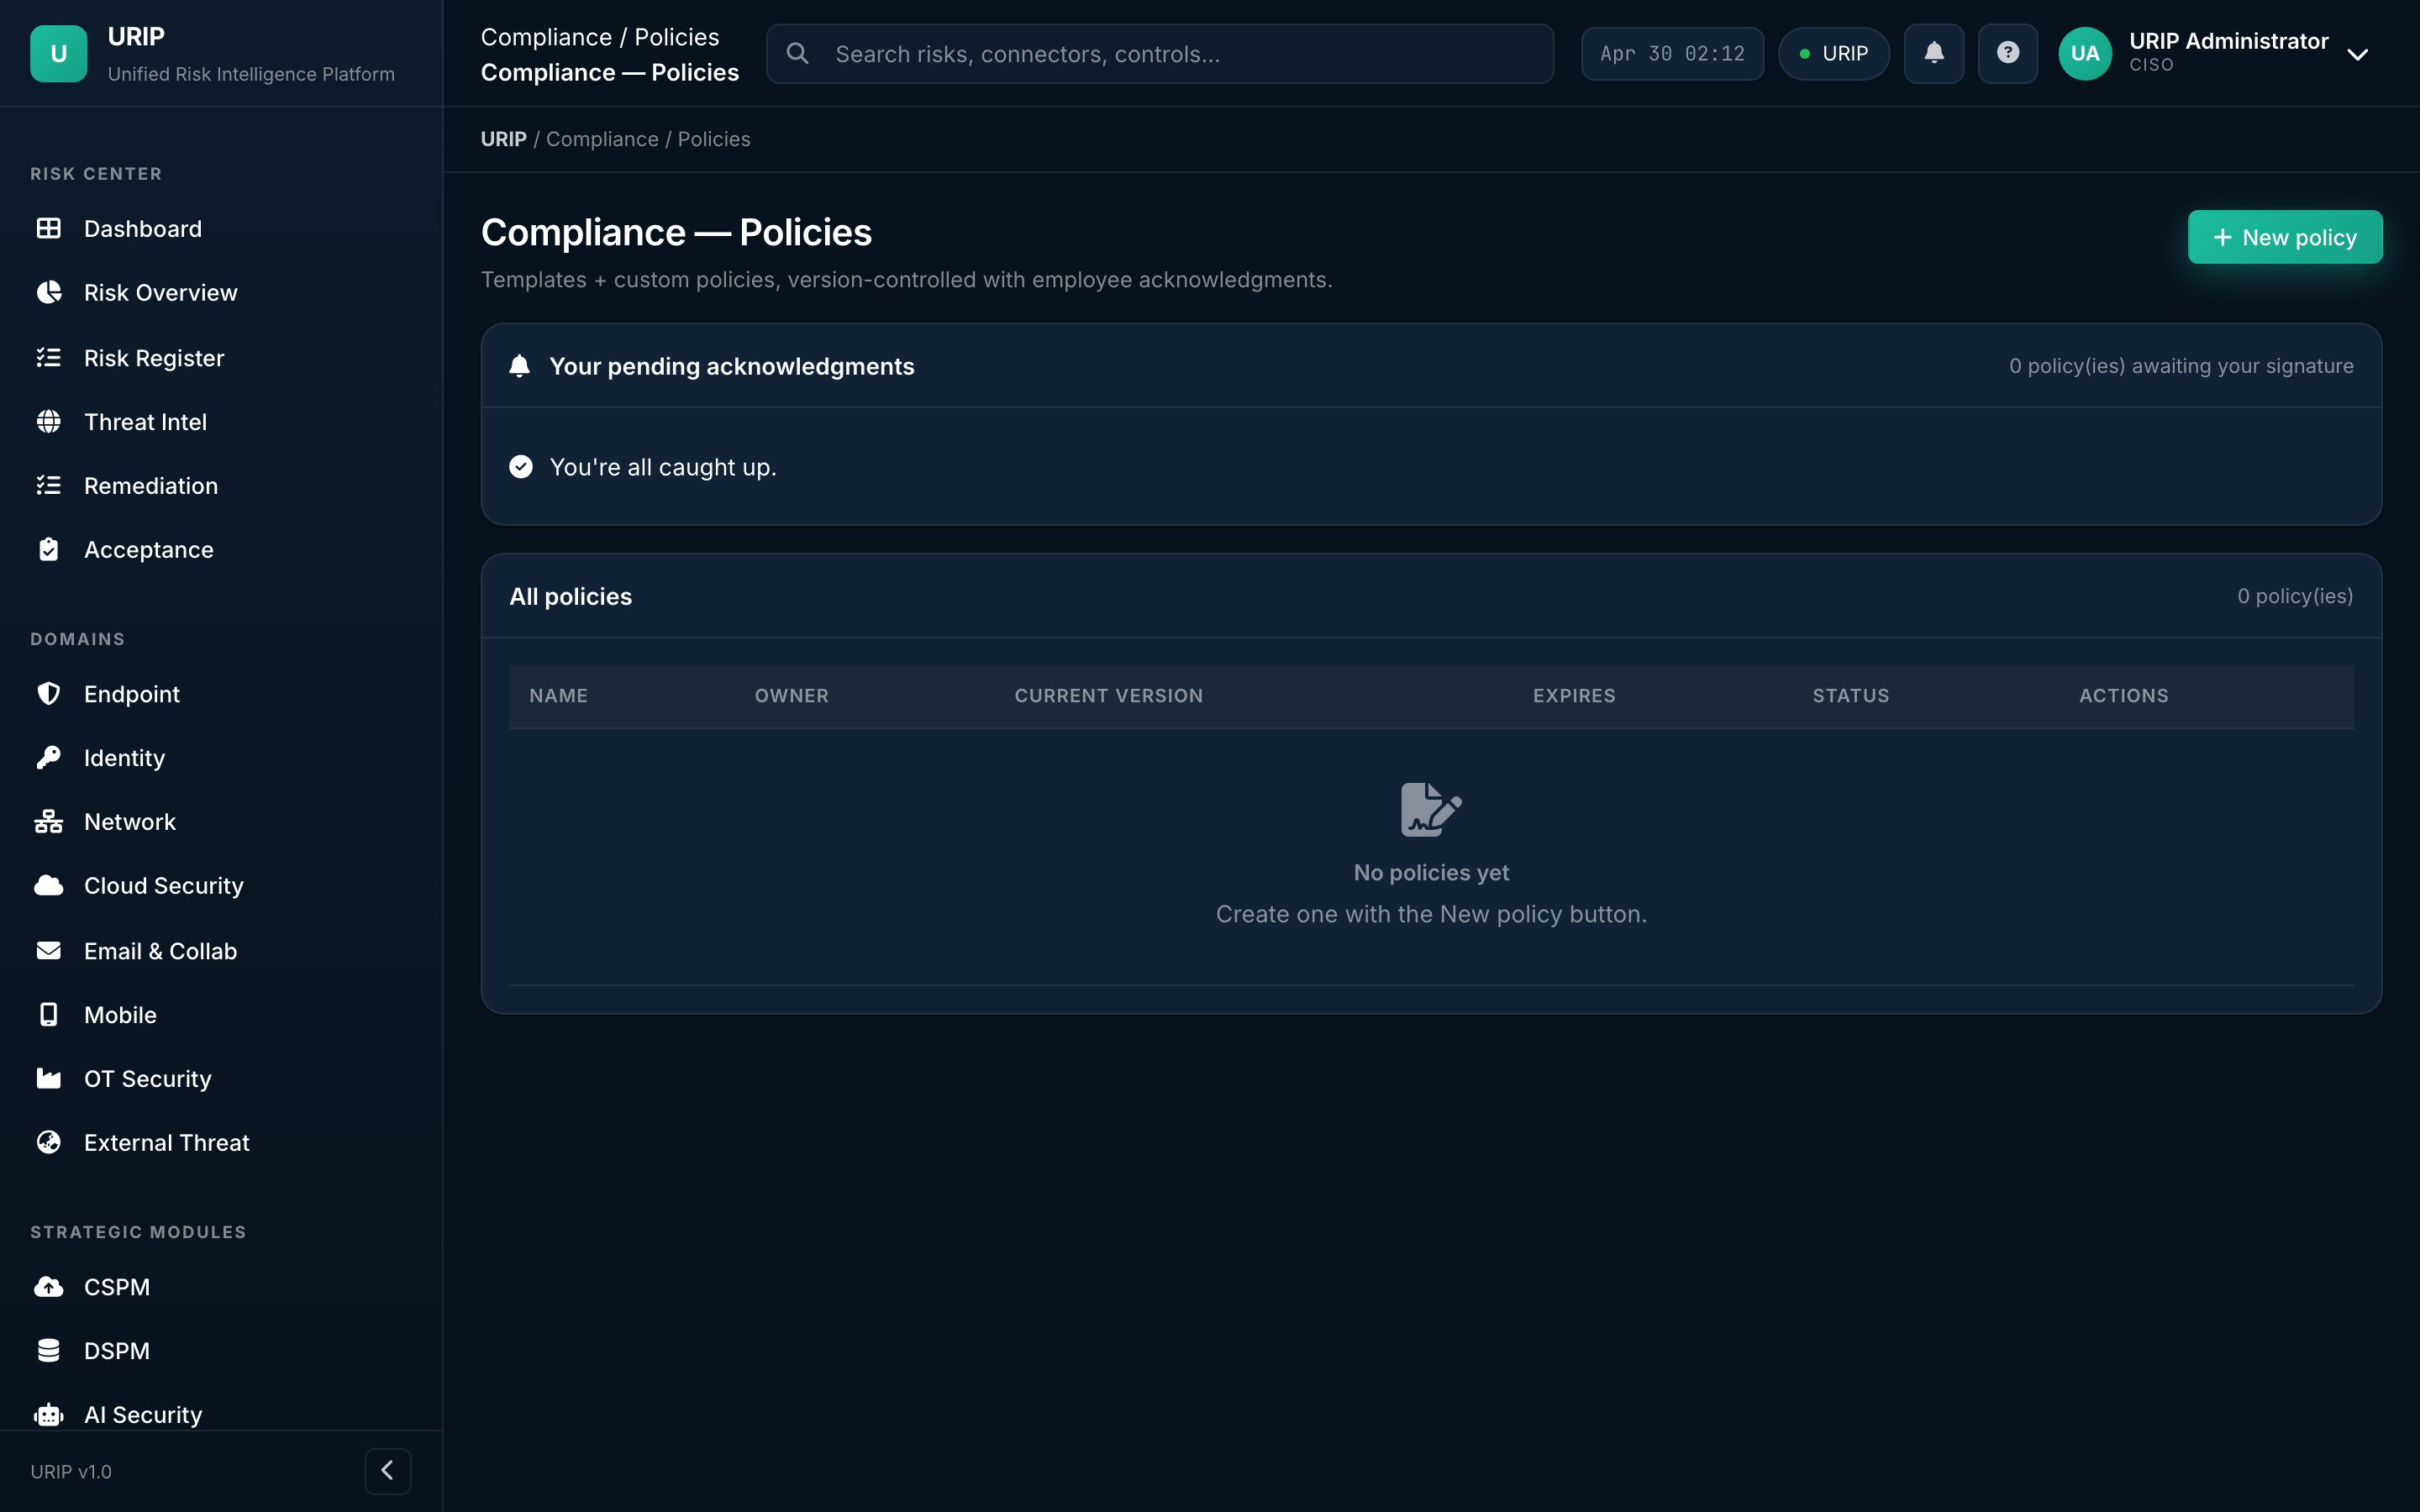
What it shows. Policy library — every written policy mapped to the controls it satisfies. Versioned, with attestation tracking (who's read, who's signed, who's overdue).
Evidence library
URL: /compliance-evidence.html
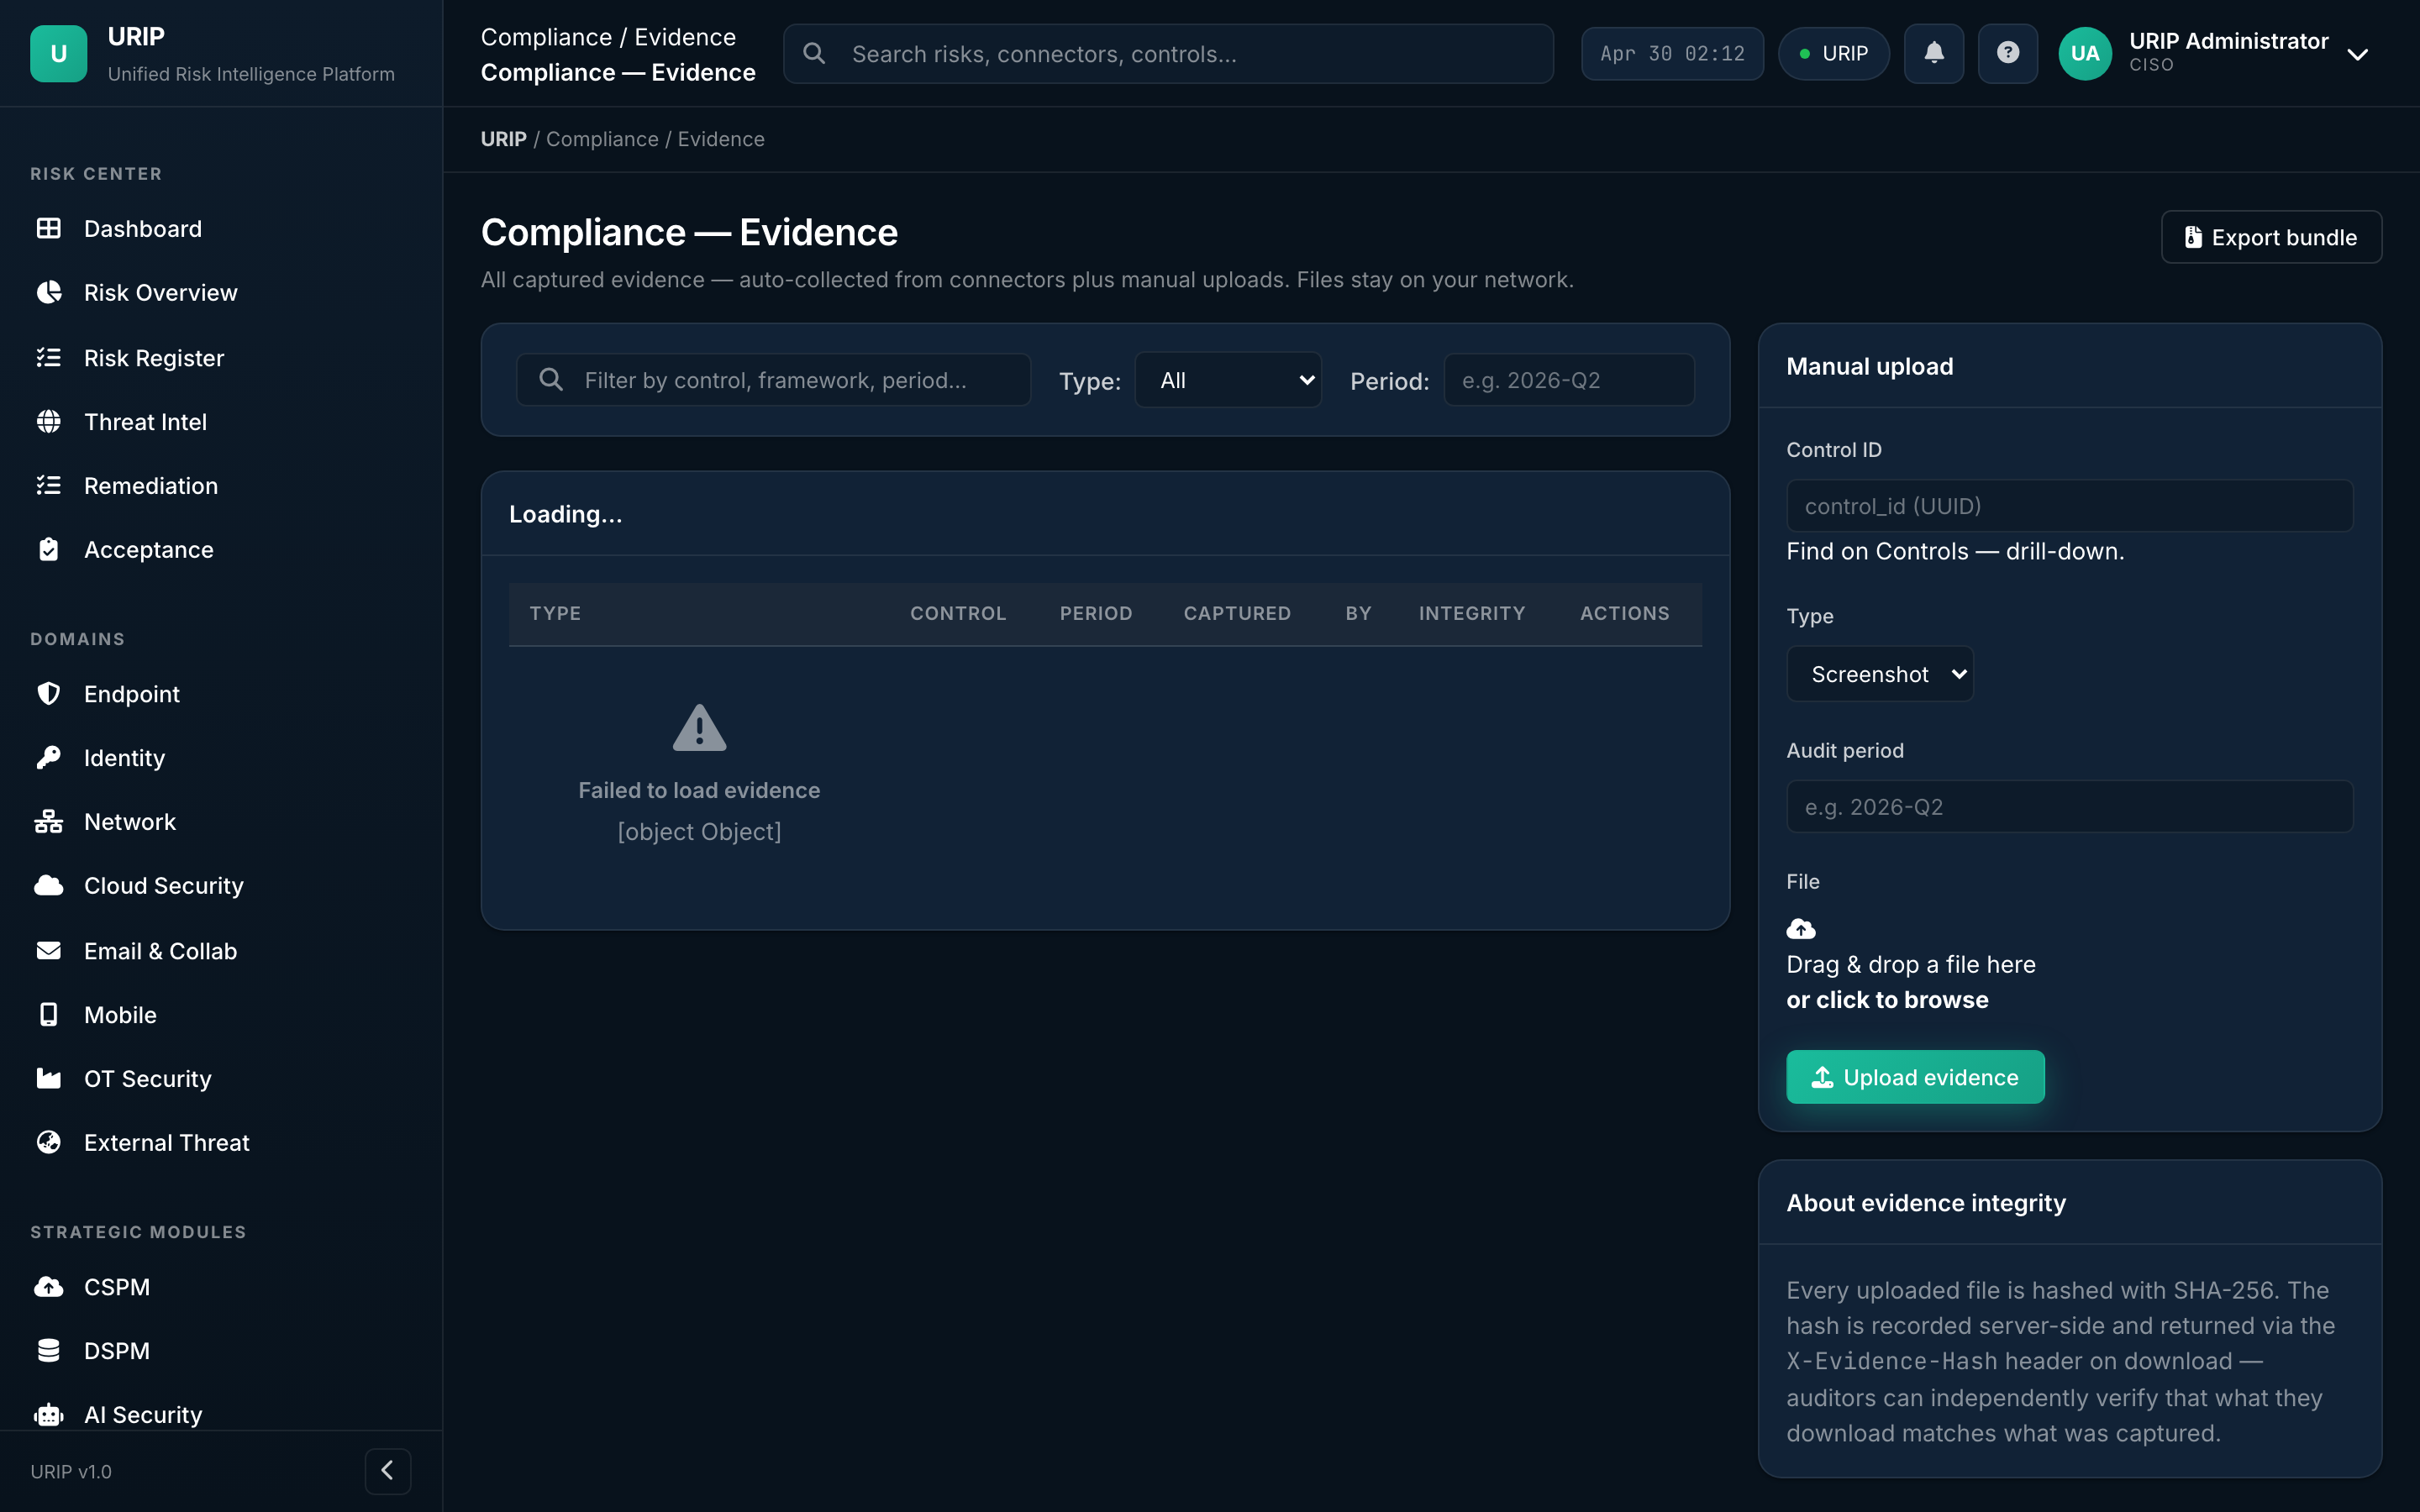
What it shows. All evidence files (PDF, screenshots, exports) with the controls they satisfy, expiry dates (auto-prompts re-collection), and provenance (uploaded by, source connector).
Evidence requests (auditor inbox)
URL: /compliance-evidence-requests.html
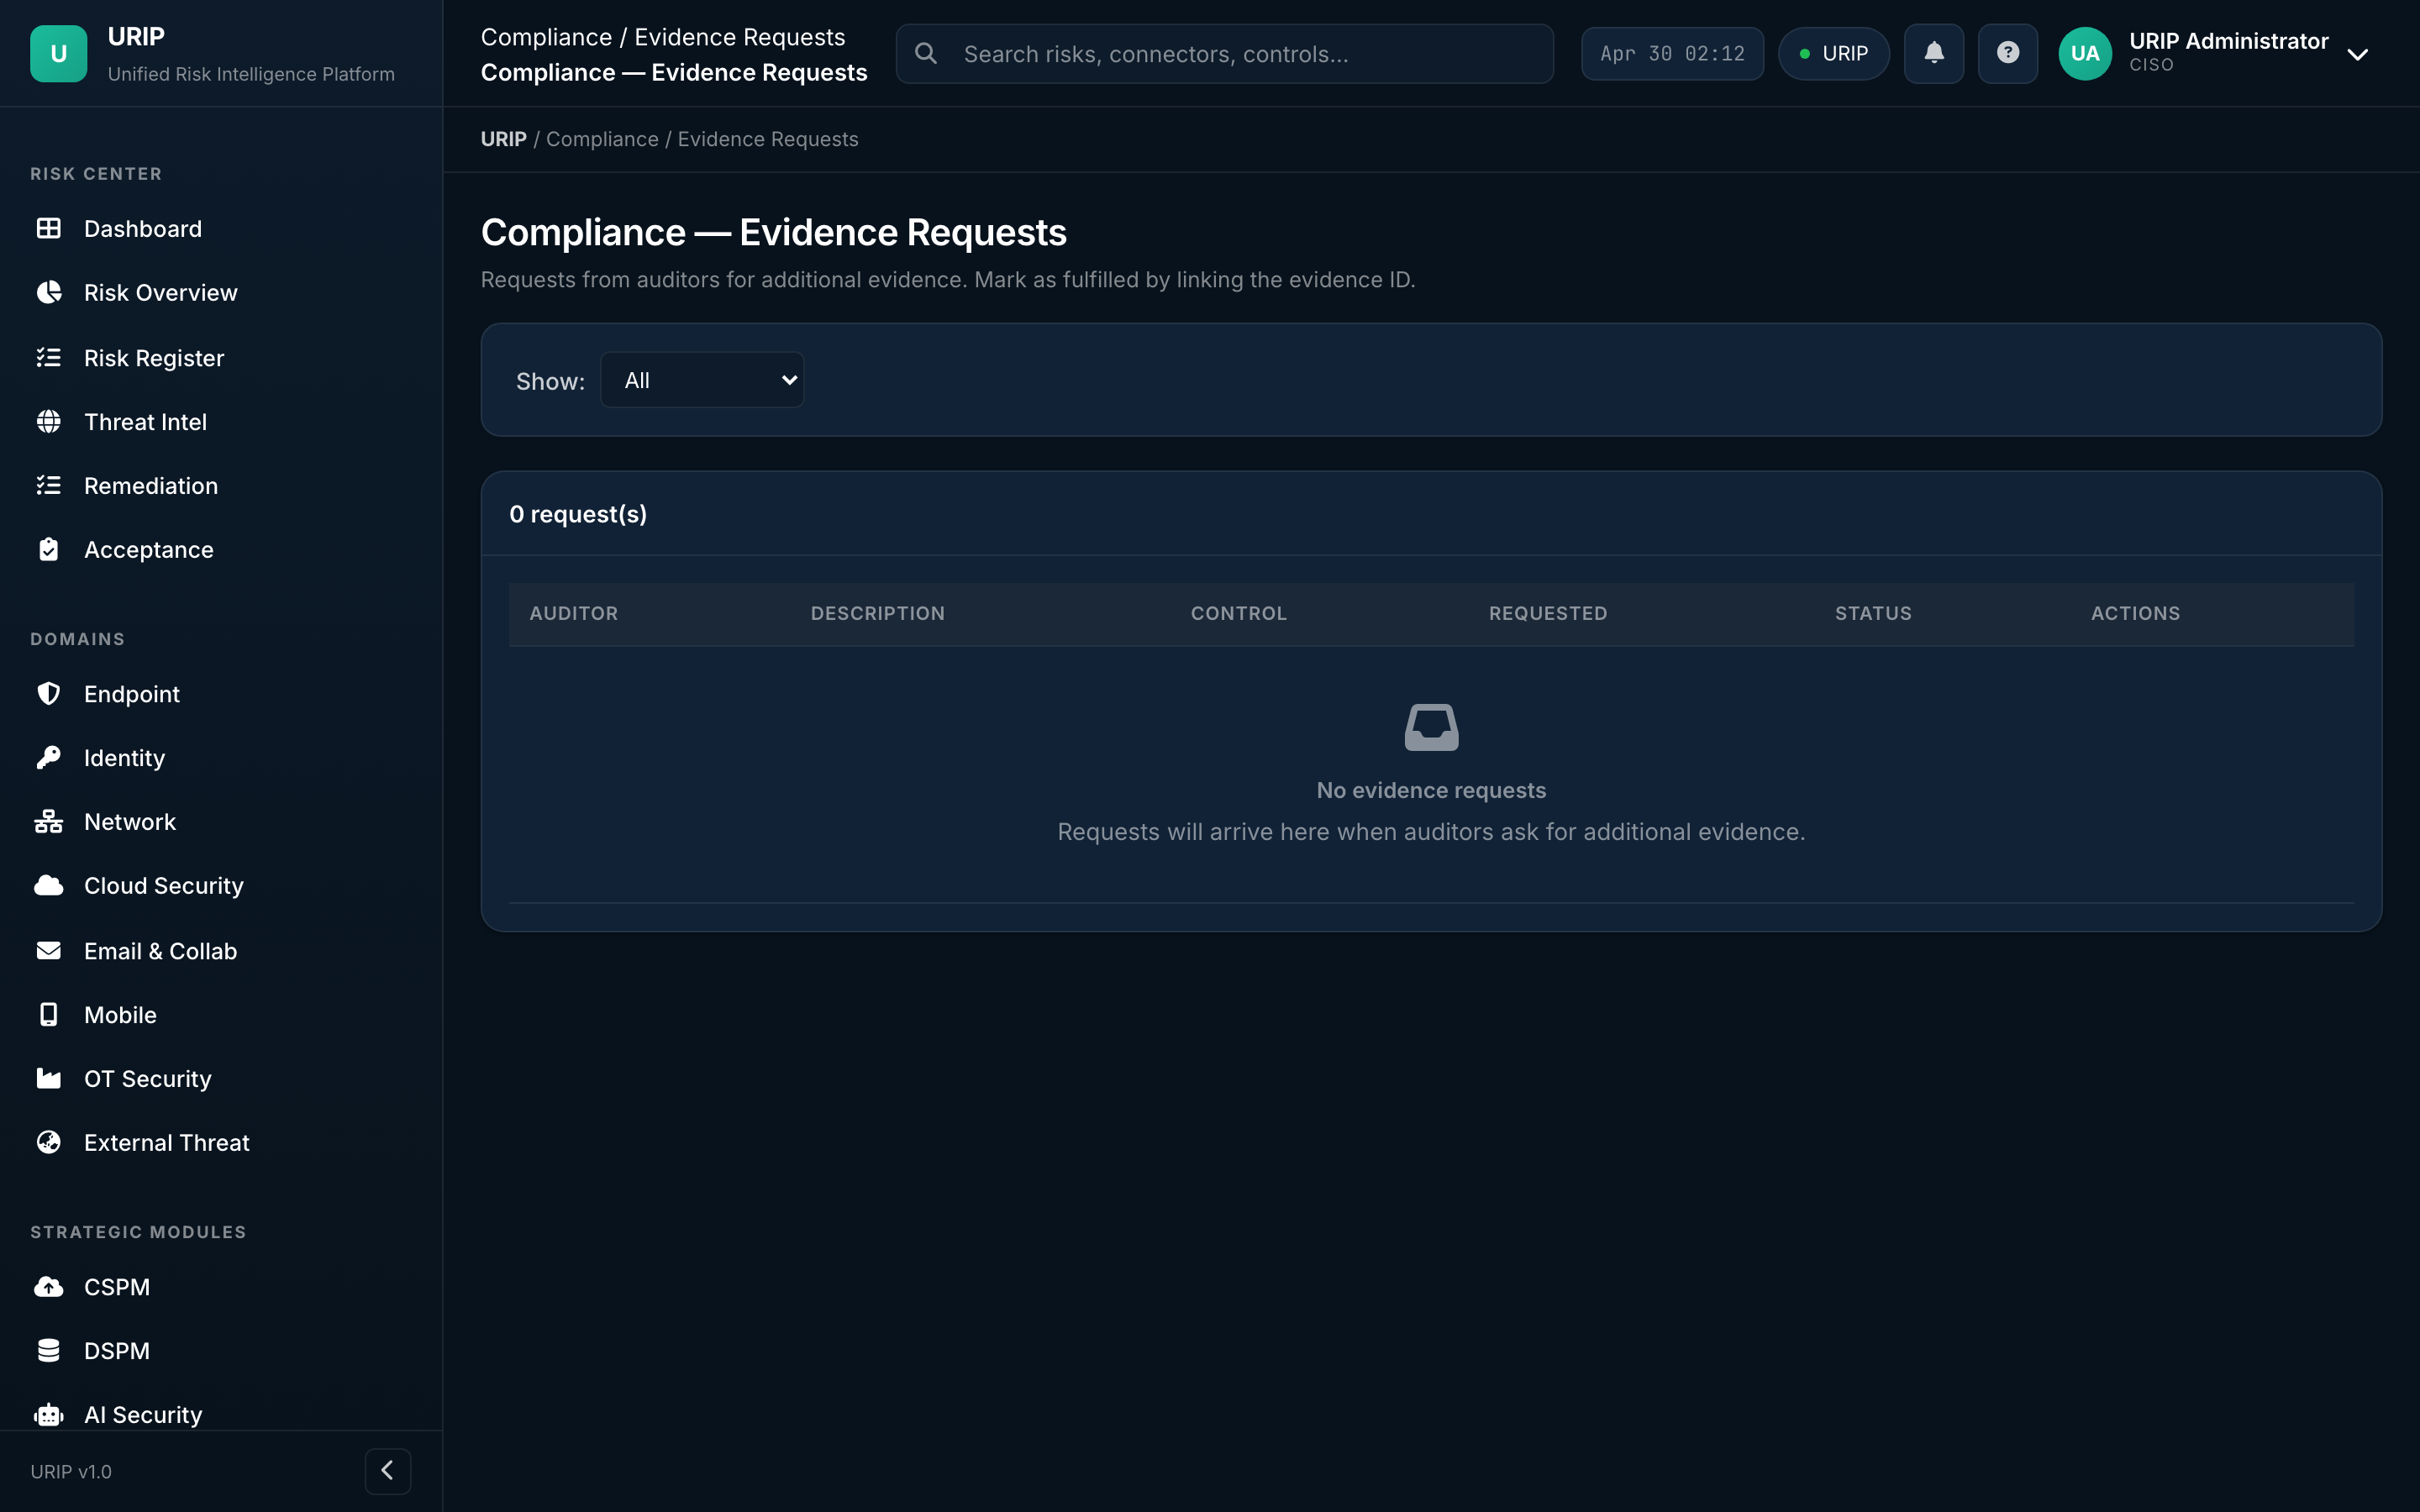
What it shows. Auditor inbox — every request from your external auditor, the status (open / in-progress / answered / accepted), the response thread, and the evidence files attached.
What you do here. Reply to auditor → attach evidence → mark resolved → auditor accepts.
Vendor risk
URL: /compliance-vendors.html
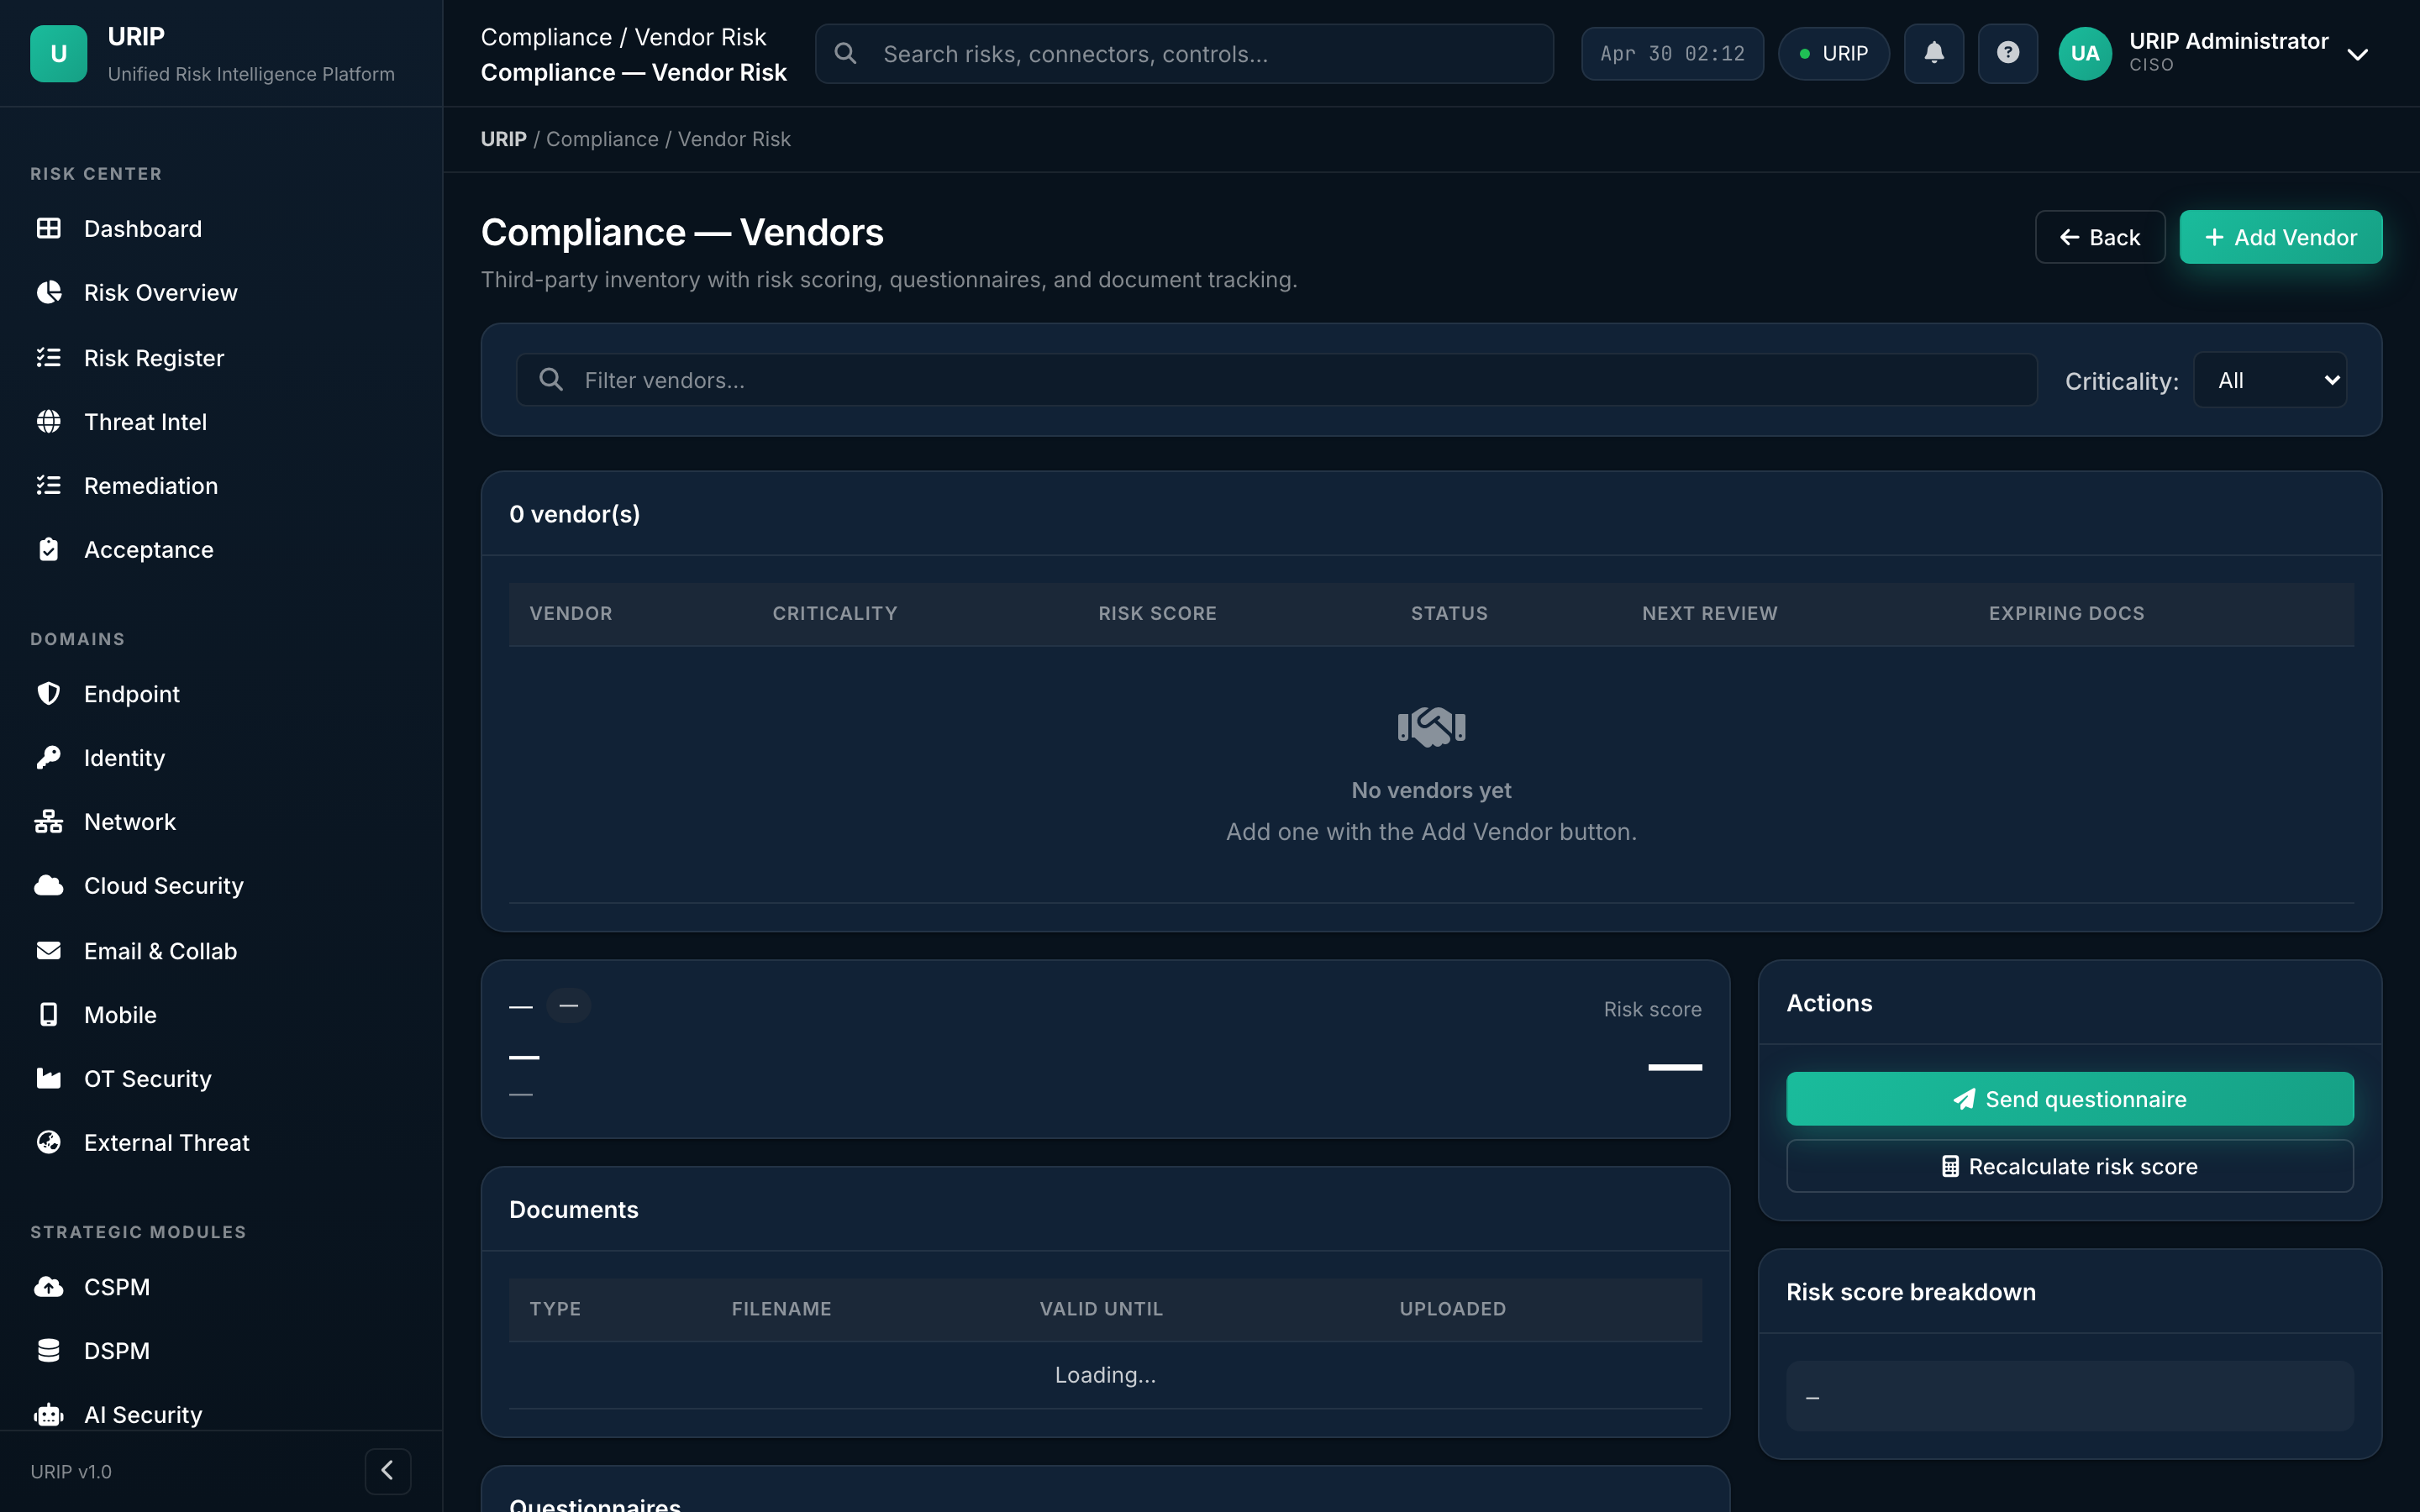
What it shows. Vendor / third-party risk register — each vendor's risk tier, SOC 2 / ISO certification status, contract expiry, recent security questionnaire scores.
Compliance reports
URL: /compliance-reports.html
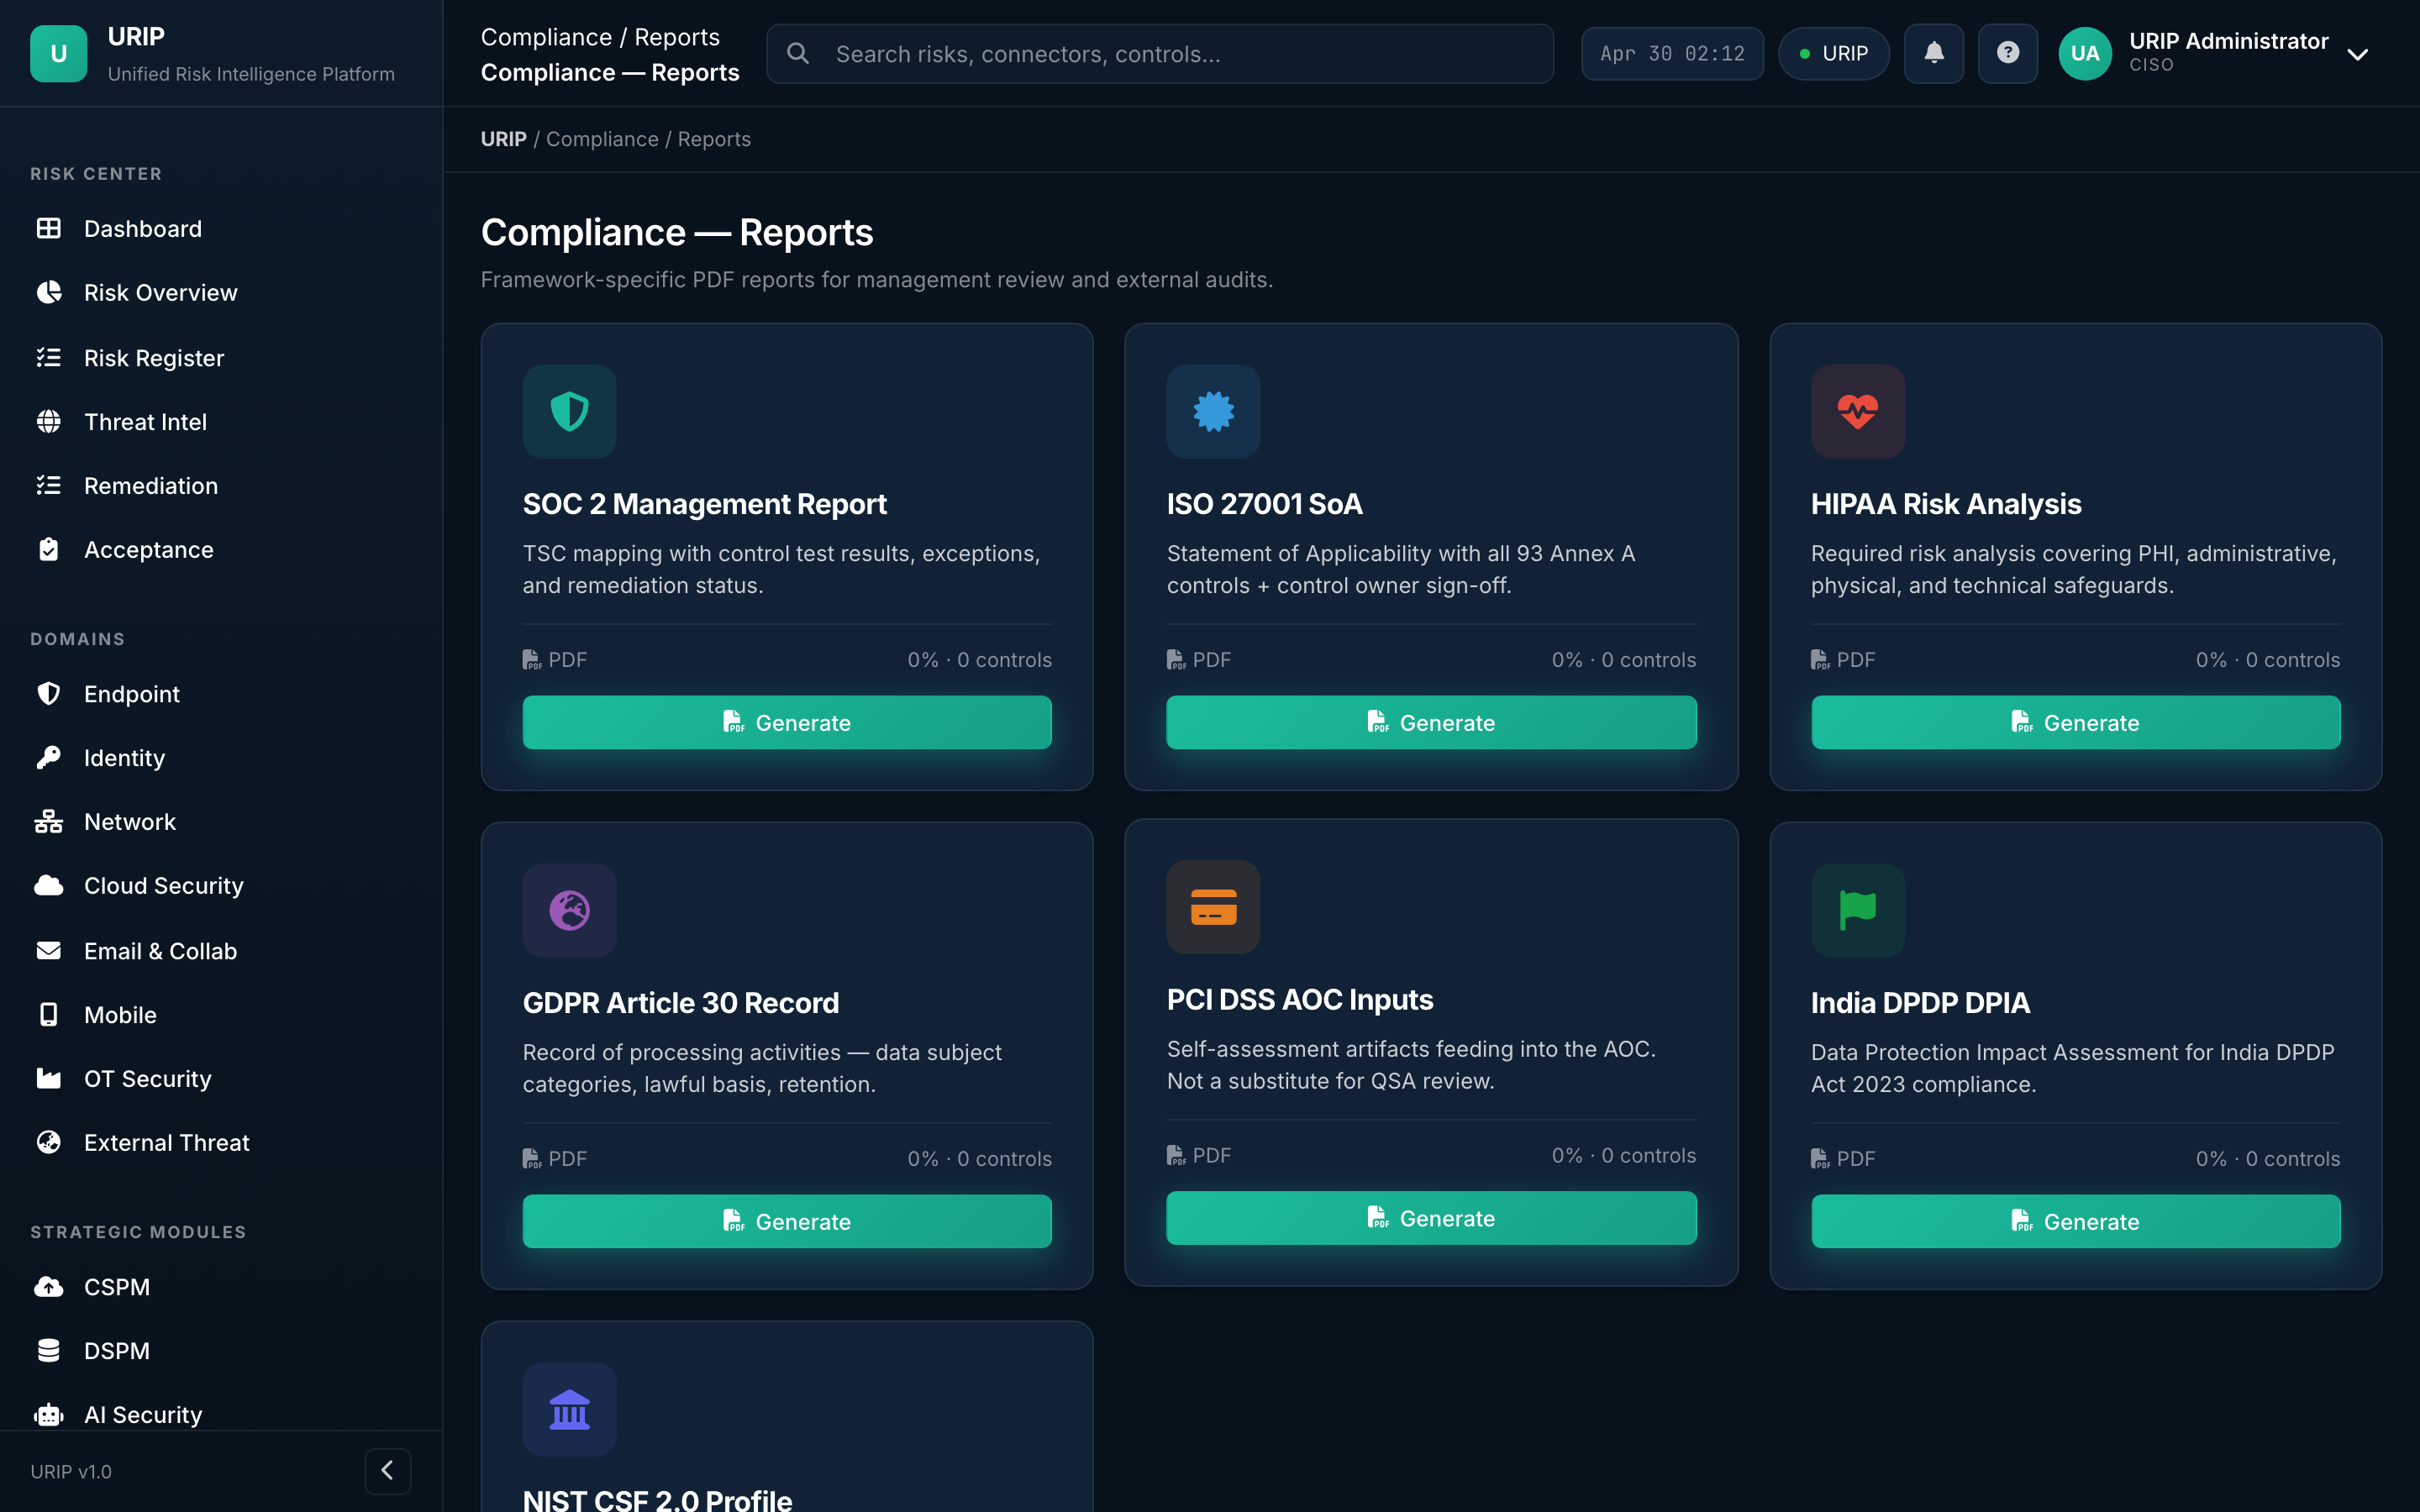
What it shows. Pre-built compliance reports — gap analysis, evidence pack export, audit-ready package per framework, board-level compliance summary.
End-to-end demo path
If you have 10 minutes and want to see URIP working, walk this sequence:
- Login → email + password + MFA
- Dashboard — read the four KPI tiles, hover the heat map, click "Critical: 38"
- Risk Register opens filtered to critical — pick the top row
- Risk detail → see the connector source, EPSS / KEV badges, affected assets, suggested fix
- Click Push to Jira — ticket created, watch Remediation Tracker light up
- Compliance Frameworks → SOC 2 grade, click any failing control
- Control detail → see the evidence behind the pass/fail and the linked risk
- Reports → trigger a Board Pack PDF
- Audit Log — verify every action you just took is signed and chained
That's the entire URIP loop in 10 minutes. Everything else in this document is depth on each step.