URIP User Guide
Last updated: 2026-04-29
Status: Stable
Audience: CISOs, Security Analysts, Compliance Officers, IT Administrators
CISO Executive Summary
URIP is the cockpit for your security stack — not another tool in it. It connects to what you already own, enriches every finding with live exploit intelligence, and gives you one unified view of risk and compliance.
Why this matters to the business:
| Business concern | How URIP addresses it |
|---|---|
| "Are we compliant if the auditor lands next week?" | Activate any of 20 frameworks and see pass/fail status within one hour — with exact CVEs linked to each failing control |
| "Which risks could actually cost us money?" | FAIR-based Risk Quantification converts technical scores into estimated Annual Loss Expectancy (ALE) in your currency |
| "Are we spending security budget on the right things?" | Overlapping-coverage visibility shows when two tools report the same finding; domain-level dashboards show where investment reduces risk fastest |
| "How do I explain our posture to the board?" | Risk Overview exports a PDF with composite trend, domain heat map, top assets at risk, and EPSS distribution — board-ready in one click |
Time to value: Most organisations see their first risks on the dashboard within 30 minutes of connecting their first tool. Full compliance framework evaluation completes within one hour of connector activation.
Table of Contents
- Overview
- Navigation
- Risk Center - Risk Dashboard - Risk Overview - Risk Register - Threat Intelligence - Remediation Tracker - Risk Acceptance
- Security Domains
- Strategic Modules
- Compliance
- Tool Catalogue
- Workflows & Automation
- Admin & Settings
- Risk Scoring
1. Overview
URIP is a platform that aggregates security findings from your existing tools, enriches them with live threat intelligence, and presents unified risk and compliance dashboards — both on the same data, no double entry required.
Two dashboards, one platform:
- Risk Intelligence Dashboard (
/dashboard.html) — answers the CISO's daily question: Where am I most exposed today? - Compliance Dashboard (
/compliance/index.html) — answers: If the audit landed next week, would we pass?
Both render from the same data. When a SOC 2 control fails, you see the exact CVEs causing it. No spreadsheet pivoting required.
2. Navigation
The left sidebar (shell navigation) is present on all authenticated pages. Key sections:
| Sidebar Item | URL | Description |
|---|---|---|
| Dashboard | /dashboard.html |
Risk KPI overview |
| Risk Overview | /risk-overview.html |
Executive risk summary |
| Risk Register | /risk-register.html |
Full finding list + filters |
| Threat Intel | /threat-map.html |
Live threat map + feeds |
| Remediation | /remediation-tracker.html |
Open remediations + SLA |
| Asset Inventory | /asset-inventory.html |
All assets with criticality |
| Tool Catalog | /tool-catalog.html |
61 connectors |
| Compliance | /compliance/index.html |
Compliance dashboard |
| Reports | /reports.html |
Scheduled + on-demand reports |
| Settings | /settings.html |
Users, connectors, RBAC |
| Admin | /admin-tenants.html |
Super-admin only |
The top-right header shows: tenant name, notification bell, and user avatar menu.
3. Risk Center
3.1 Risk Dashboard
URL: /dashboard.html
Purpose: Real-time overview of your organisation's security posture.
KPI Cards (top row):
| Card | Description |
|---|---|
| Total Open Risks | Count of all open findings across all connectors |
| Critical | Composite score ≥ 9.0 |
| High | Composite score 7.0–8.9 |
| Medium | Composite score 4.0–6.9 |
| Low | Composite score < 4.0 |
| KEV Exposed | Findings in CISA Known Exploited Vulnerabilities catalog |
SLA Banner: Appears at top when overdue risks exist. Click View Now to go directly to the overdue risk list.
Charts:
- Risk by Domain — donut chart showing distribution across Endpoint, Identity, Network, Cloud, Email, Mobile, OT, External Threat
- Risk Trend — 30-day line chart of open risk count
- Top 10 Risks — table of highest-scored open risks with direct drill-down
- Connector Health — grid showing each configured connector's status:
ok(green) /degraded(yellow) /error(red)
Actions: - Export — downloads dashboard snapshot as PDF - Refresh — triggers an immediate UI refresh (does not trigger connector poll)
Pitfalls:
- If all KPIs show --, no connectors are configured. Go to Tool Catalog first.
- Connector health "degraded" often means rate-limiting on the vendor API — not a credential issue.
See also: guides/risk-center.md, QUICKSTART.md — Step 4
3.2 Risk Overview
URL: /risk-overview.html
Purpose: Executive-level risk summary suitable for board reporting.
Displays: - Composite risk score trend (30/60/90 days) - Risk heat map by domain and severity - Top 5 assets at risk - EPSS distribution chart — percentage of your open CVEs with high exploit probability
Use this view for board or senior management presentations. The Export button generates a PDF with your tenant logo.
3.3 Risk Register
URL: /risk-register.html
Purpose: Full list of all open findings with filtering, sorting, and bulk actions.
Columns:
| Column | Description |
|---|---|
| ID | Internal URIP risk ID |
| Title | Finding name (CVE ID for vulnerabilities, advisory title for others) |
| Score | Composite URIP score (0–10) — colour-coded |
| Severity | Critical / High / Medium / Low |
| Domain | Security domain (Endpoint, Identity, etc.) |
| Source | Connector(s) that reported this finding |
| Asset | Affected asset hostname/IP |
| KEV | Flag if in CISA KEV catalog |
| EPSS | Exploit probability (%) |
| Assigned | Assignee (if assigned) |
| Due | Remediation due date |
| Status | Open / In Progress / Pending Retest |
Filters: - Severity (multi-select) - Domain (multi-select) - Source connector - KEV only - Assigned to me - Date range (created / due) - Asset criticality tier (T1–T4)
Risk Detail Drawer (click any row): - Full description + CVE links - Score breakdown (CVSS × 0.55 + EPSS × 2.5 + KEV bonus + asset tier) - Affected asset metadata - MITRE ATT&CK technique attribution - OTX IOC matches - Remediation steps (auto-fetched) - Source list (which connectors reported this finding) - Assign / comment / change status actions
Bulk Actions: - Select multiple rows → Assign, Accept, Suppress, Export
Pitfalls: - De-duplication is automatic. The same CVE on the same asset from multiple sources appears as one row. - "Pending Retest" status means a retest has been triggered via auto-remediation.
3.4 Threat Intelligence
URL: /threat-map.html
Purpose: Live threat intelligence map and feed viewer.
Live Feeds:
| Feed | Source | Updates |
|---|---|---|
| EPSS scores | FIRST.org | Daily |
| KEV catalog | CISA | As published |
| APT attribution | MITRE ATT&CK | Monthly |
| IOC matches | AlienVault OTX | Real-time pulses |
Threat Map: World map showing active threat actor geolocation, OTX pulse origins, and IOC activity. Hover a marker for details.
Feed Panel (right): Chronological list of threat events relevant to your tenant's CVEs and assets: - New KEV entries matching your open risks - EPSS score increases for your CVEs - New OTX pulses matching your assets' IPs
Pitfalls: - The threat map shows global activity, not just your tenant. Filter by "My assets only" toggle.
3.5 Remediation Tracker
URL: /remediation-tracker.html
Purpose: Track all in-flight remediation tasks with SLA enforcement.
Columns: Risk ID, Title, Assignee, Due Date, Days Remaining, Status, Source, Actions
SLA Bands (configurable in Admin → Scoring):
| Severity | Default SLA |
|---|---|
| Critical | 7 days |
| High | 30 days |
| Medium | 90 days |
| Low | 180 days |
Overdue risks are highlighted in red. The dashboard SLA Banner fires when any critical risk exceeds its SLA.
Filters: Overdue only, Assignee, Severity, Domain, Status
Actions per row: - Mark Resolved — moves risk to Pending Retest - Request Extension — logs a justification, extends due date (audit-logged) - Auto-Remediate — triggers CrowdStrike RTR / Ansible / Fortinet / CyberArk executor (if configured)
Auto-Remediation:
URIP supports automated remediation via four executors:
- CrowdStrike RTR — remote isolation and script execution on endpoints
- Ansible — playbook-based patching for Linux/Windows servers
- Fortinet — firewall rule push for network-layer blocks
- CyberArk — credential rotation for privileged accounts
All auto-remediation actions require an approval gate and run an implication check (checks for blast radius) before execution.
Pitfalls: - Auto-remediation is disabled by default. Enable per-connector in Admin → Modules.
3.6 Risk Acceptance
URL: /acceptance-workflow.html
Purpose: Formal risk acceptance workflow with audit trail.
When a risk cannot be remediated (e.g., legacy system, vendor limitation), it must be formally accepted:
- Open the risk from Risk Register
- Click Accept Risk
- Enter: - Justification (free text, required) - Accepted by (auto-filled from session user) - Review date (required — acceptance auto-expires) - Compensating controls (optional)
- Submit → acceptance is logged in the immutable audit log
- Risk moves to "Accepted" status, removed from open risk count
Accepted risks appear in the acceptance workflow view with their expiry date. Expired acceptances automatically re-open the risk.
Pitfalls: - Accepted risks still appear in compliance control failure analysis. Acceptance does not count as a control pass.
4. Security Domains
Each domain page aggregates findings and assets from relevant connectors into a domain-specific view.
| Domain | URL | Key Connectors |
|---|---|---|
| Endpoint | /domain-endpoint.html |
CrowdStrike, SentinelOne, Defender for Endpoint, ManageEngine EC |
| Identity | /domain-identity.html |
MS Entra ID, Okta |
| Network | /domain-network.html |
Zscaler, Netskope, Cloudflare, Cisco Meraki |
| Cloud | /domain-cloud.html |
AWS CSPM, Azure CSPM, GCP CSPM, Wiz, Prisma Cloud, Orca Security |
| Email & Collaboration | /domain-email-collab.html |
Email Security (Google Workspace + M365 Defender), M365 Collaboration |
| Mobile | /domain-mobile.html |
Jamf Pro, Microsoft Intune, ManageEngine MDM |
| OT / ICS | /domain-ot.html |
Armis OT, Forescout NAC |
| External Threat | /domain-external-threat.html |
EASM (Censys/Shodan/Detectify), CloudSEK, BitSight, SafeBreach |
Each domain page shows: - Domain risk score (average composite across domain) - Asset count and managed/unmanaged split - Top findings in that domain - Connector status for domain-relevant connectors - Domain-specific trend chart
Pitfalls:
- A domain page is only meaningful if at least one relevant connector is configured.
- "Domain Compliance Summary" (/domain-compliance-summary.html) shows which frameworks have controls mapped to each domain.
5. Strategic Modules
Strategic modules are optional capability add-ons. Enable them in Admin → Modules.
5.1 CSPM — Cloud Security Posture Management
URL: /cspm-dashboard.html
Purpose: Continuous cloud misconfigurations detection across AWS, Azure, and GCP.
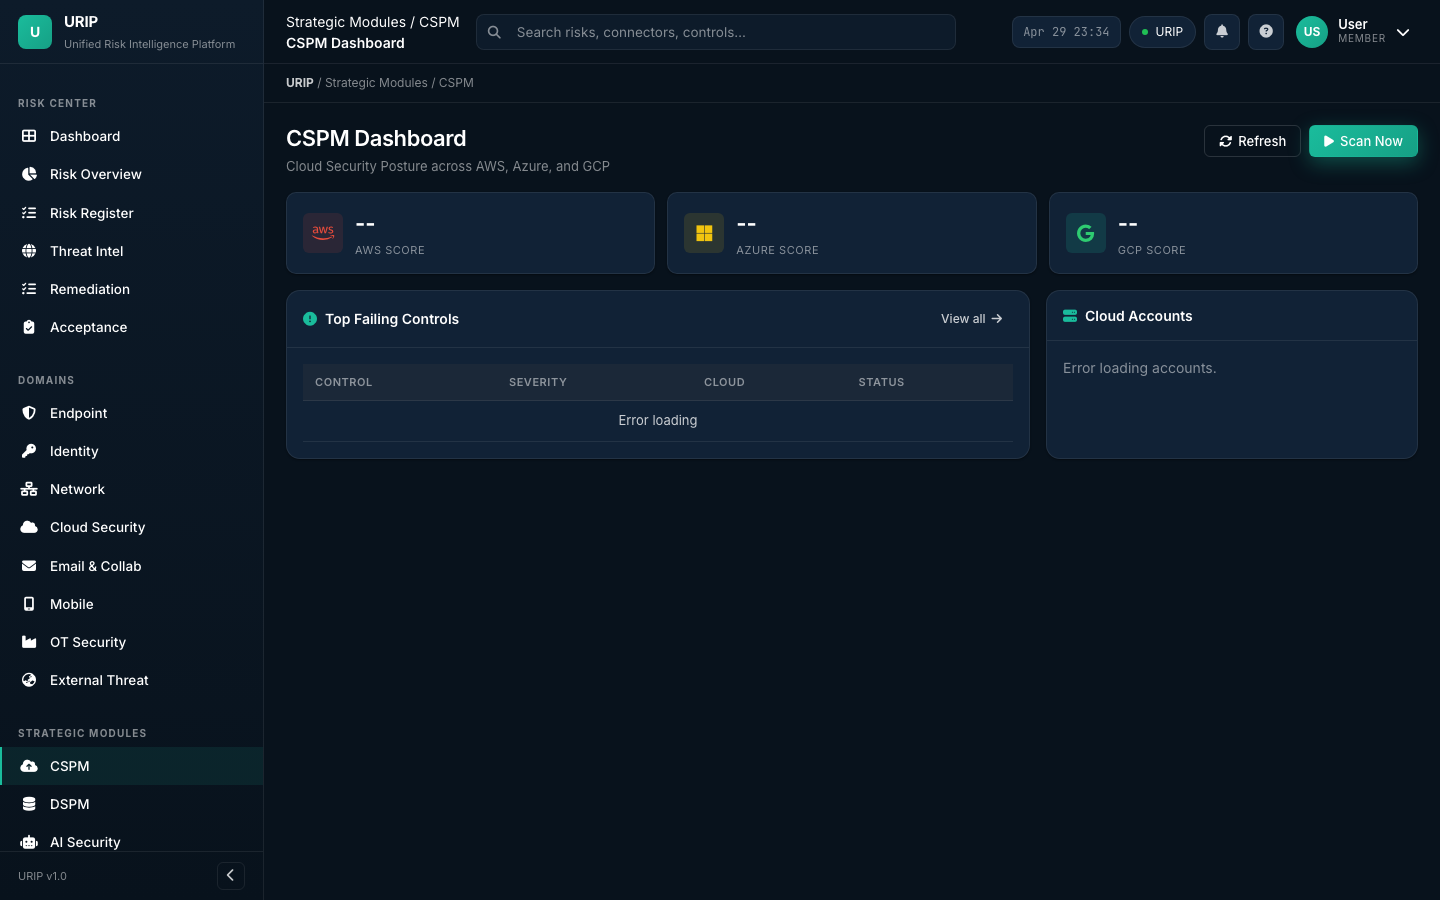
CSPM evaluates your cloud accounts against CIS Benchmarks and URIP's built-in rule set using the native cloud APIs: - AWS: AWS Config + Security Hub - Azure: Azure Policy + Security Center - GCP: GCP Security Command Center
Views:
- /cspm-dashboard.html — summary KPIs, failing controls by provider, compliance score
- /cspm-findings.html — full list of CSPM findings with filter by provider / service / severity
- /cspm-control-detail.html — per-control detail with affected resources and remediation
Prerequisites: At minimum one cloud CSPM connector configured (see CONNECTOR_CATALOGUE.md — CSPM).
5.2 DSPM — Data Security Posture Management
URL: /dspm-dashboard.html
Purpose: Discover and classify sensitive data at rest — structured (databases) and unstructured (files).
| Connector | Coverage |
|---|---|
| BigID | Structured data — databases, data warehouses |
| Varonis | Unstructured data — file shares, SharePoint, NAS |
DSPM surfaces: over-privileged data access, sensitive data in unencrypted stores, data sprawl across cloud buckets.
Note: DSPM module is early-access. The UI and data model are complete; BigID and Varonis connectors pull real data. AI-driven auto-classification policy recommendations are roadmap items.
5.3 AI Security Dashboard
URL: /ai-security-dashboard.html
Purpose: Track AI governance risk and ISO 42001 / EU AI Act compliance posture.
Surfaces AI-related risks: model supply chain vulnerabilities (Snyk SCA on ML deps), AI system inventory control failures, data governance gaps from DSPM, and ISO 42001 / EU AI Act control status.
Note: AI Security module is early-access. The risk aggregation from existing connectors is functional; AI-specific autonomous scanning is a roadmap item.
5.4 ZTNA — Zero Trust Network Access
URL: /ztna-dashboard.html
Purpose: Zero Trust posture visibility — device trust, identity trust, and network access anomalies.
Aggregates from: Zscaler ZPA, Netskope ZTNA, MS Entra Conditional Access, Okta device trust.
Note: ZTNA module is early-access — aggregation and display are functional; automated policy enforcement is roadmap.
5.5 Attack Path Analysis
URL: /attack-path.html
Purpose: Visualise multi-hop attack paths from external exposure to crown-jewel assets.
Uses graph analysis on the asset graph (built from all connector data) to identify: external exposure → lateral movement vector → high-value asset chains. Each path is scored by exploitability.
Note: Attack Path module is early-access. Graph engine uses real asset + risk data; AI-driven path prioritisation is roadmap.
5.6 Cyber Risk Quantification (FAIR)
URL: /risk-quantification.html
Purpose: Financial quantification of cyber risk using FAIR methodology.
Converts composite risk scores to annual loss expectancy (ALE) in currency, enabling board-level risk investment decisions. Inputs: asset business value (T1–T4), threat frequency from EPSS + KEV, vulnerability severity.
Note: Risk Quantification is early-access. Financial modelling uses FAIR calculation engine; actuarial calibration against external loss databases is roadmap.
6. Compliance
See guides/compliance.md for the complete walkthrough.
Quick reference:
| Page | URL | Purpose |
|---|---|---|
| Dashboard | /compliance/index.html |
Overall scores across all active frameworks |
| Frameworks | /compliance-frameworks.html |
List and detail for all 20 frameworks |
| Controls | /compliance-controls.html |
Full control inventory with pass/fail/evidence |
| Evidence | /compliance-evidence.html |
Evidence library — upload, link, manage |
| Evidence Requests | /compliance-evidence-requests.html |
Auditor evidence request tracking |
| Policies | /compliance-policies.html |
Policy document repository |
| Vendor Risk | /compliance-vendors.html |
Third-party vendor risk assessments |
| Reports | /compliance-reports.html |
Auditor-grade reports, export to PDF |
| Auditor Activity | /compliance-auditor-activity.html |
Read-only auditor session log |
| Auditor Invitations | /compliance-auditor-invitations.html |
Manage auditor access tokens |
20 supported frameworks: SOC 2, ISO 27001, GDPR, HIPAA, PCI DSS v4.0, India DPDP, NIST CSF 2.0, ISO 42001, EU AI Act, DORA, NIS2, ISO 27017, ISO 27018, ISO 27701, CIS Controls v8, SEC Cyber Disclosure, CMMC 2.0, HITRUST CSF v11, SOC 1, ISO 22301.
See COMPLIANCE_FRAMEWORKS.md for full details.
7. Tool Catalogue
URL: /tool-catalog.html
Purpose: Browse, configure, and manage all 61 security tool connectors.
KPI Strip (top):
| KPI | Description |
|---|---|
| Available integrations | Total connectors in the catalog |
| Configured | Connectors your tenant has credentials for |
| Healthy | Connectors with last-poll status: ok |
| Errors (24h) | Connectors with errors in the last 24 hours |
Filter bar: Search by name, filter by category, filter by configured/available status.
Connector tile: Shows vendor logo, display name, category badge, setup difficulty (Low/Medium/High), last poll timestamp, health status pill.
Setup Drawer (opens on tile click): - Quick facts (poll frequency, data freshness, difficulty) - What's pulled (finding types, asset types) - Prerequisites (API permissions, vendor plan requirements) - Step-by-step setup - Required scopes / permissions - Sample data preview - Common errors + fixes - Disconnect steps
Categories: VM, EDR, CSPM, DSPM, IDENTITY, NETWORK, DLP, SOC, FIREWALL, EMAIL, COLLABORATION, ITSM, LMS, BGV, HRIS, PAM, NAC, OT, DAST, BAS, EASM, EXTERNAL_THREAT, ADVISORY, BUG_BOUNTY, GRC.
See CONNECTOR_CATALOGUE.md for all 61 connectors.
8. Workflows & Automation
See guides/workflows.md for the full workflow guide.
Available workflows:
| Workflow | URL | Description |
|---|---|---|
| Risk → Ticket | /domain-workflow.html |
Auto-create Jira / ServiceNow ticket on risk assignment |
| Ticket → Risk Close | Webhook | HMAC-signed webhook closes URIP risk when ticket resolves |
| Risk → Auto-Remediate | Remediation Tracker | CrowdStrike RTR / Ansible / Fortinet / CyberArk executors |
| Finding → Acceptance | Acceptance Workflow | Formal accept-with-justification + auto-expiry |
| VAPT Submission | /vapt-portal-submit.html |
VAPT vendor submits findings via structured form |
| Trust Center | External URL | Public compliance posture page with NDA e-sign |
9. Admin & Settings
See guides/admin-settings.md for the full admin guide.
Settings (/settings.html) — available to ciso and admin roles:
- Users tab: Invite users, set roles, reset MFA, deactivate accounts
- Connectors tab: View all configured connectors, re-test, remove
Admin pages (super-admin only):
| Page | URL | Purpose |
|---|---|---|
| Tenants | /admin-tenants.html |
Create / manage tenants |
| Tenant Detail | /admin-tenant-detail.html |
Per-tenant config, modules, user management |
| Modules | /admin-modules.html |
Enable/disable license modules per tenant |
| Scoring Config | /admin-scoring.html |
Customise CVSS / EPSS / KEV weights and SLA bands |
| VAPT Admin | /admin-vapt.html |
Manage VAPT vendor submissions |
Roles:
| Role | Access |
|---|---|
| Viewer | Read-only: dashboard, risk register, reports |
| Analyst | Viewer + assign risks, add comments, upload evidence |
| CISO | Analyst + configure connectors, manage users, export |
| Compliance Officer | Analyst + full compliance module access |
| Super-Admin | All access including multi-tenant administration |
10. Risk Scoring
URIP computes a composite 0–10 risk score for every finding:
URIP combines four signals to compute each risk's score:
- Base severity from the vulnerability standard (CVSS) — weighted at 55%
- Exploit probability in the next 30 days (EPSS from FIRST.org) — this is the highest-weight signal
- Whether the vulnerability is actively being exploited right now (CISA KEV) — adds a significant boost
- How business-critical the affected asset is (Tier 1–4) — adjusts the score up or down
Input signals:
| Signal | Source | Meaning |
|---|---|---|
| CVSS base severity | NVD | Theoretical severity of the vulnerability |
| EPSS probability | FIRST.org | Likelihood the vulnerability will be exploited in the next 30 days |
| KEV flag | CISA | Confirms the vulnerability is being actively exploited right now |
| Asset tier | Your configuration | How business-critical the affected asset is |
Severity thresholds:
| Score | Severity |
|---|---|
| 9.0 – 10.0 | Critical |
| 7.0 – 8.9 | High |
| 4.0 – 6.9 | Medium |
| 0.0 – 3.9 | Low |
Asset Tiers:
| Tier | Definition | Examples |
|---|---|---|
| T1 | Business-critical — production systems, crown jewels | Production DB, PLC, domain controller |
| T2 | Important — internal tools, non-production prod | Internal wiki, dev servers |
| T3 | Standard — typical workstations | Standard laptops |
| T4 | Low-value — canteen Wi-Fi, lab devices | Guest network AP |
Weights are configurable by your URIP super-admin at Admin → Scoring Configuration.
Risk Overview vs Risk Register — What's the Difference?
| Risk Overview | Risk Register | |
|---|---|---|
| Purpose | Executive summary for board reporting | Operational working list for analysts |
| Audience | CISO, board, senior management | Security analysts, engineers |
| Content | Trend lines, heat maps, top 5 assets, EPSS distribution | Every individual finding with full detail |
| Interactivity | Read-only with PDF export | Filter, sort, assign, accept, comment, bulk actions |
| Updates | Cached every 5 minutes | Real-time |
| Best for | "Are we getting better or worse?" | "What do I fix first today?" |
When to use each: - Start your week with Risk Overview to understand posture trend - Spend your day in the Risk Register triaging and assigning findings - Export Risk Overview as PDF for the board - Export Risk Register as CSV for engineering sprint planning
Simultaneous Editing
Can two people edit the same risk at the same time?
Yes. URIP does not lock risk records. If two analysts open the same risk and both click Save, the last write wins. The earlier save is overwritten in the UI but both versions are preserved in the audit log.
How to avoid collisions: - Use the Comment feature to coordinate ("@alice taking this one") - If you see a risk status change unexpectedly, check the Activity tab in the detail drawer to see who changed it
How to recover the previous version: - Open the risk detail drawer - Go to the Activity tab - Every save is logged with the user's name, timestamp, and the values that changed
See Also
- Quickstart — Getting started
- Connector Catalogue — All 61 connectors
- Compliance Frameworks — All 20 frameworks
- Architecture — How URIP works
- Troubleshooting — Problem resolution